Event sources and collection
Check that every device, tenant and network device is sending security events, choose what agents collect, and add firewalls and gateways that send syslog.
Detections are only as good as the events behind them. Security > Sources shows where events come from and whether each source is sending, and Settings > Security monitoring decides what is collected and for how long.
Sources
The Sources page has a tab per kind of source, each with a count of the ones that need a look:
| Tab | What it lists |
|---|---|
| Devices | Every approved agent: its health, customer, OS, events in the last 24 hours, the last event, events dropped today, and the collection policy it gets |
| Microsoft 365 | Each connected tenant and its streams |
| Network devices | Firewalls and gateways sending syslog |
| Unassigned senders | Addresses sending syslog that match no network source (last 7 days) |
| Ingest errors | Events that could not be read, with the reason and the raw line |
| Integrations | Security consoles, see Integrations and alerting |
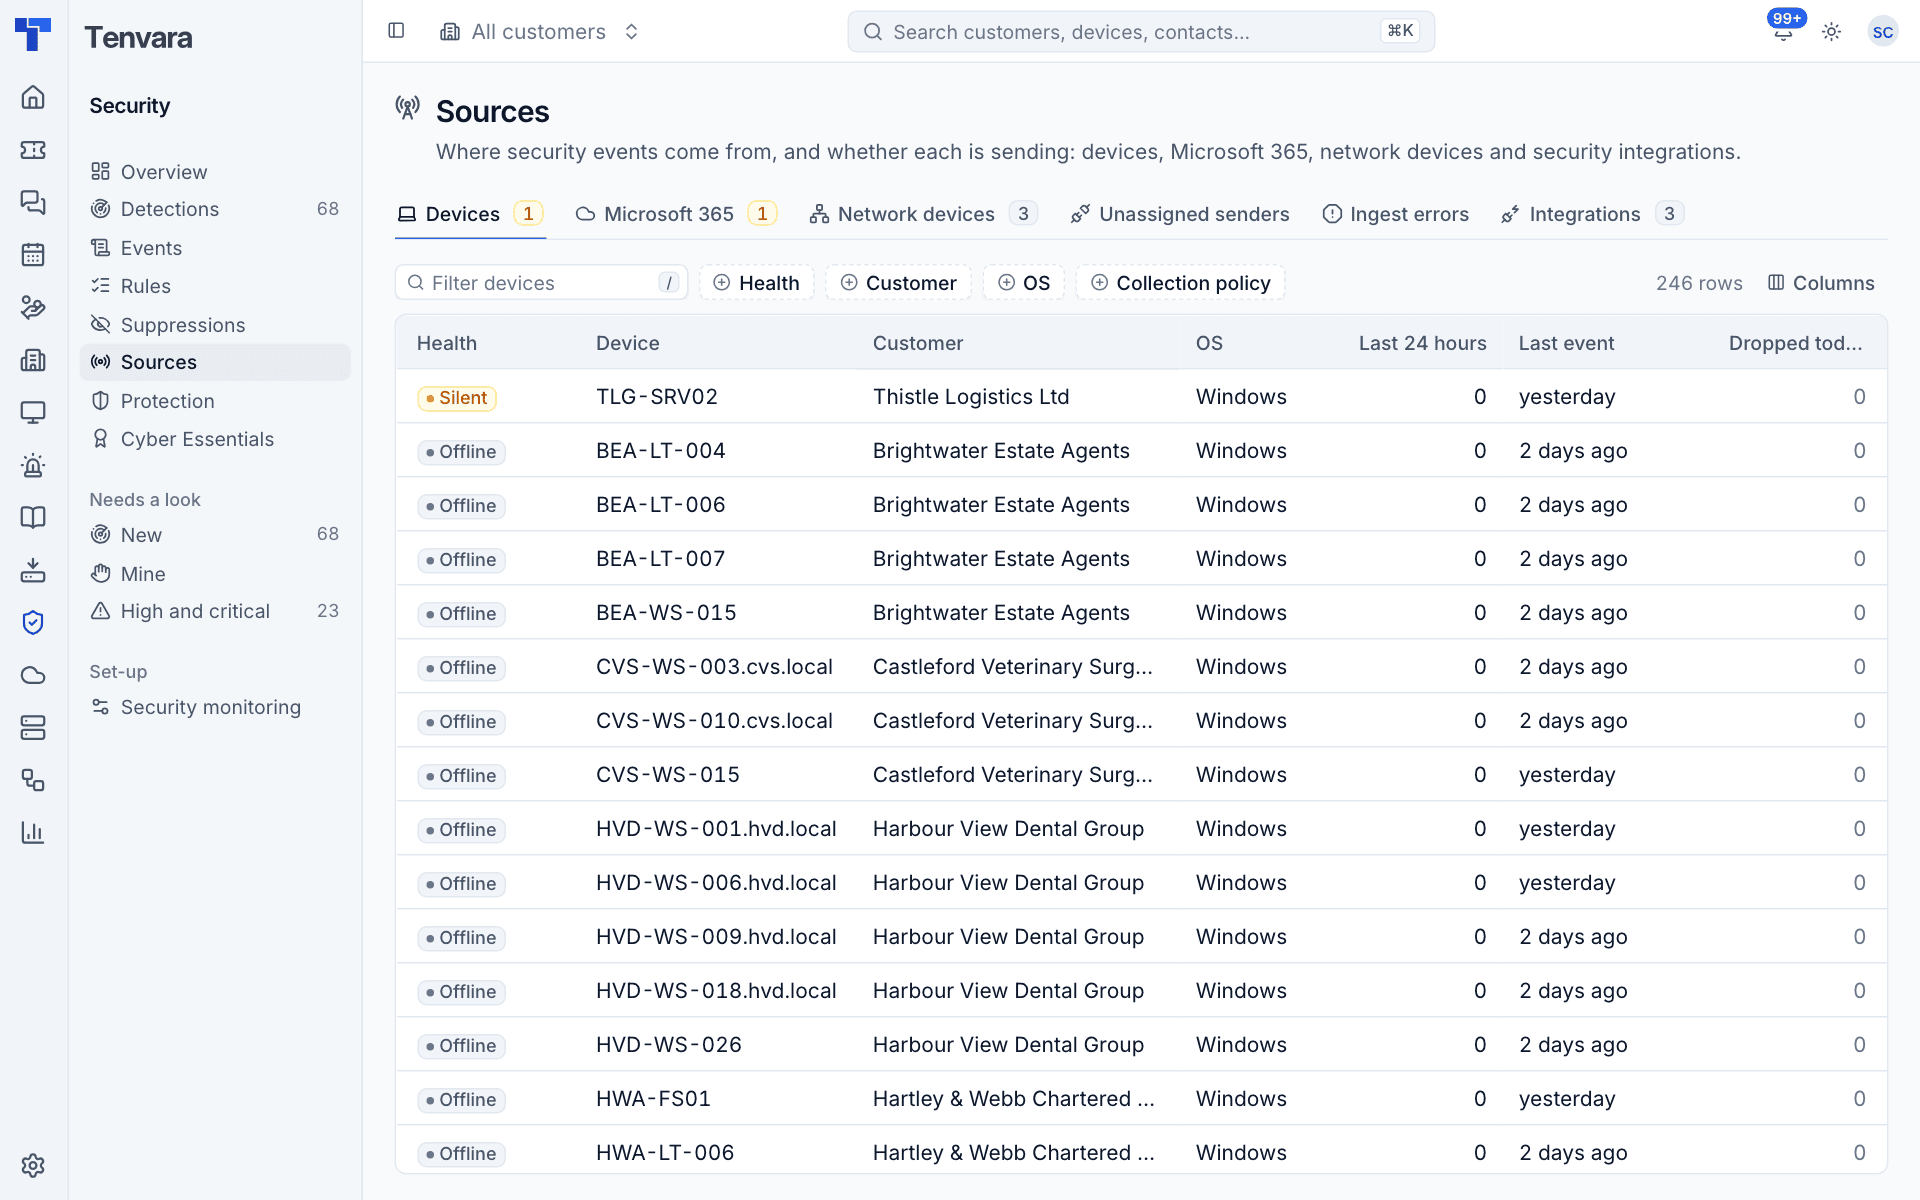
Health
- Receiving: events are arriving.
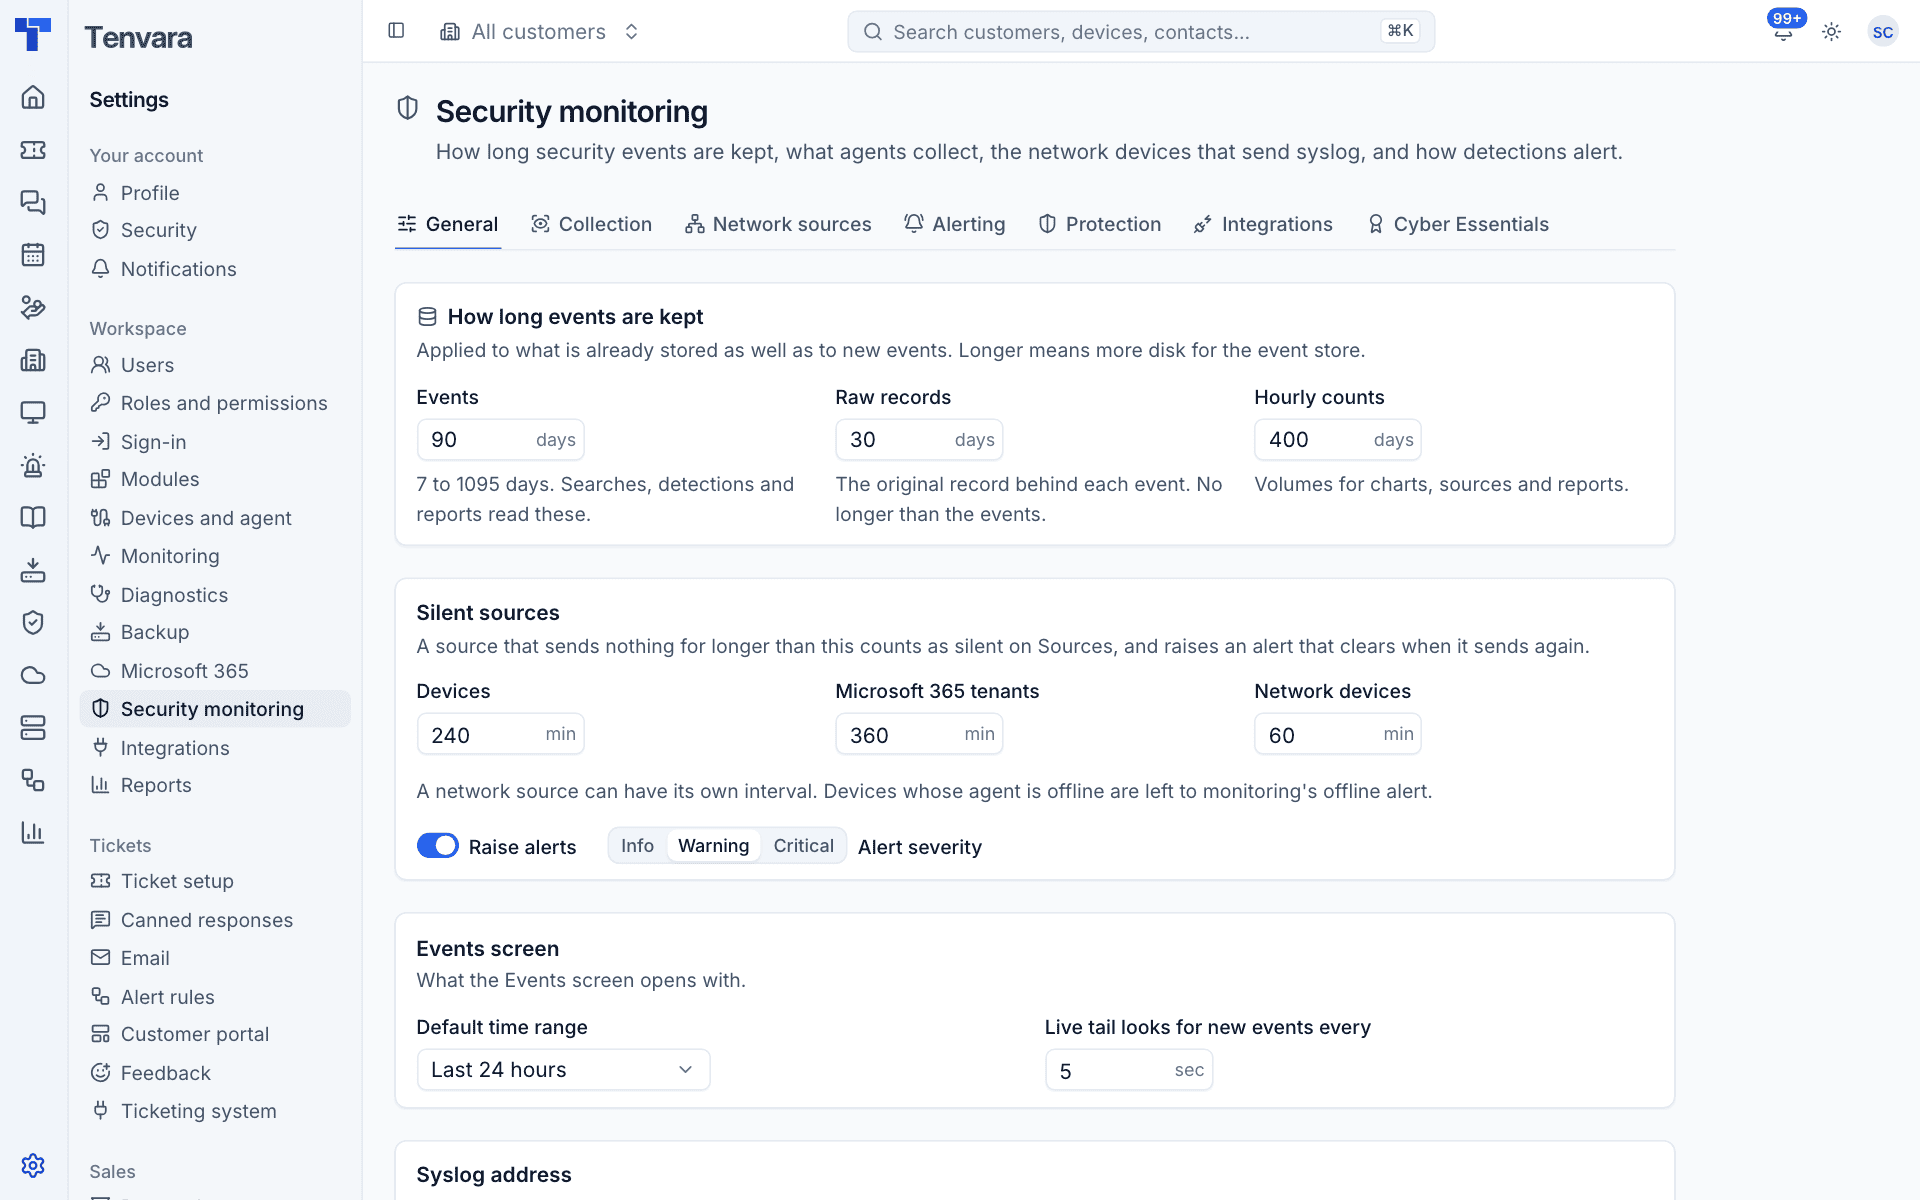
- Silent: nothing has arrived for longer than the silent limit (by default 4 hours for devices, 6 hours for Microsoft 365 tenants, 1 hour for network devices). A silent source raises an alert that clears when it sends again.
- Offline: the device's agent is offline. That is left to monitoring's offline alert rather than raising a second one.
- Waiting: a new source that has not sent anything yet.
- Off or error: collection is switched off, or the agent's security module reports a problem.
Microsoft 365 streams
Each connected tenant has seven streams: Sign-ins, Directory audit log, Risk detections, and the unified audit log for Entra ID, Exchange, SharePoint and OneDrive, and Teams and other services. Each shows its status, how far it has Read up to, the Last run and Records read. Search its events opens the tenant's events.
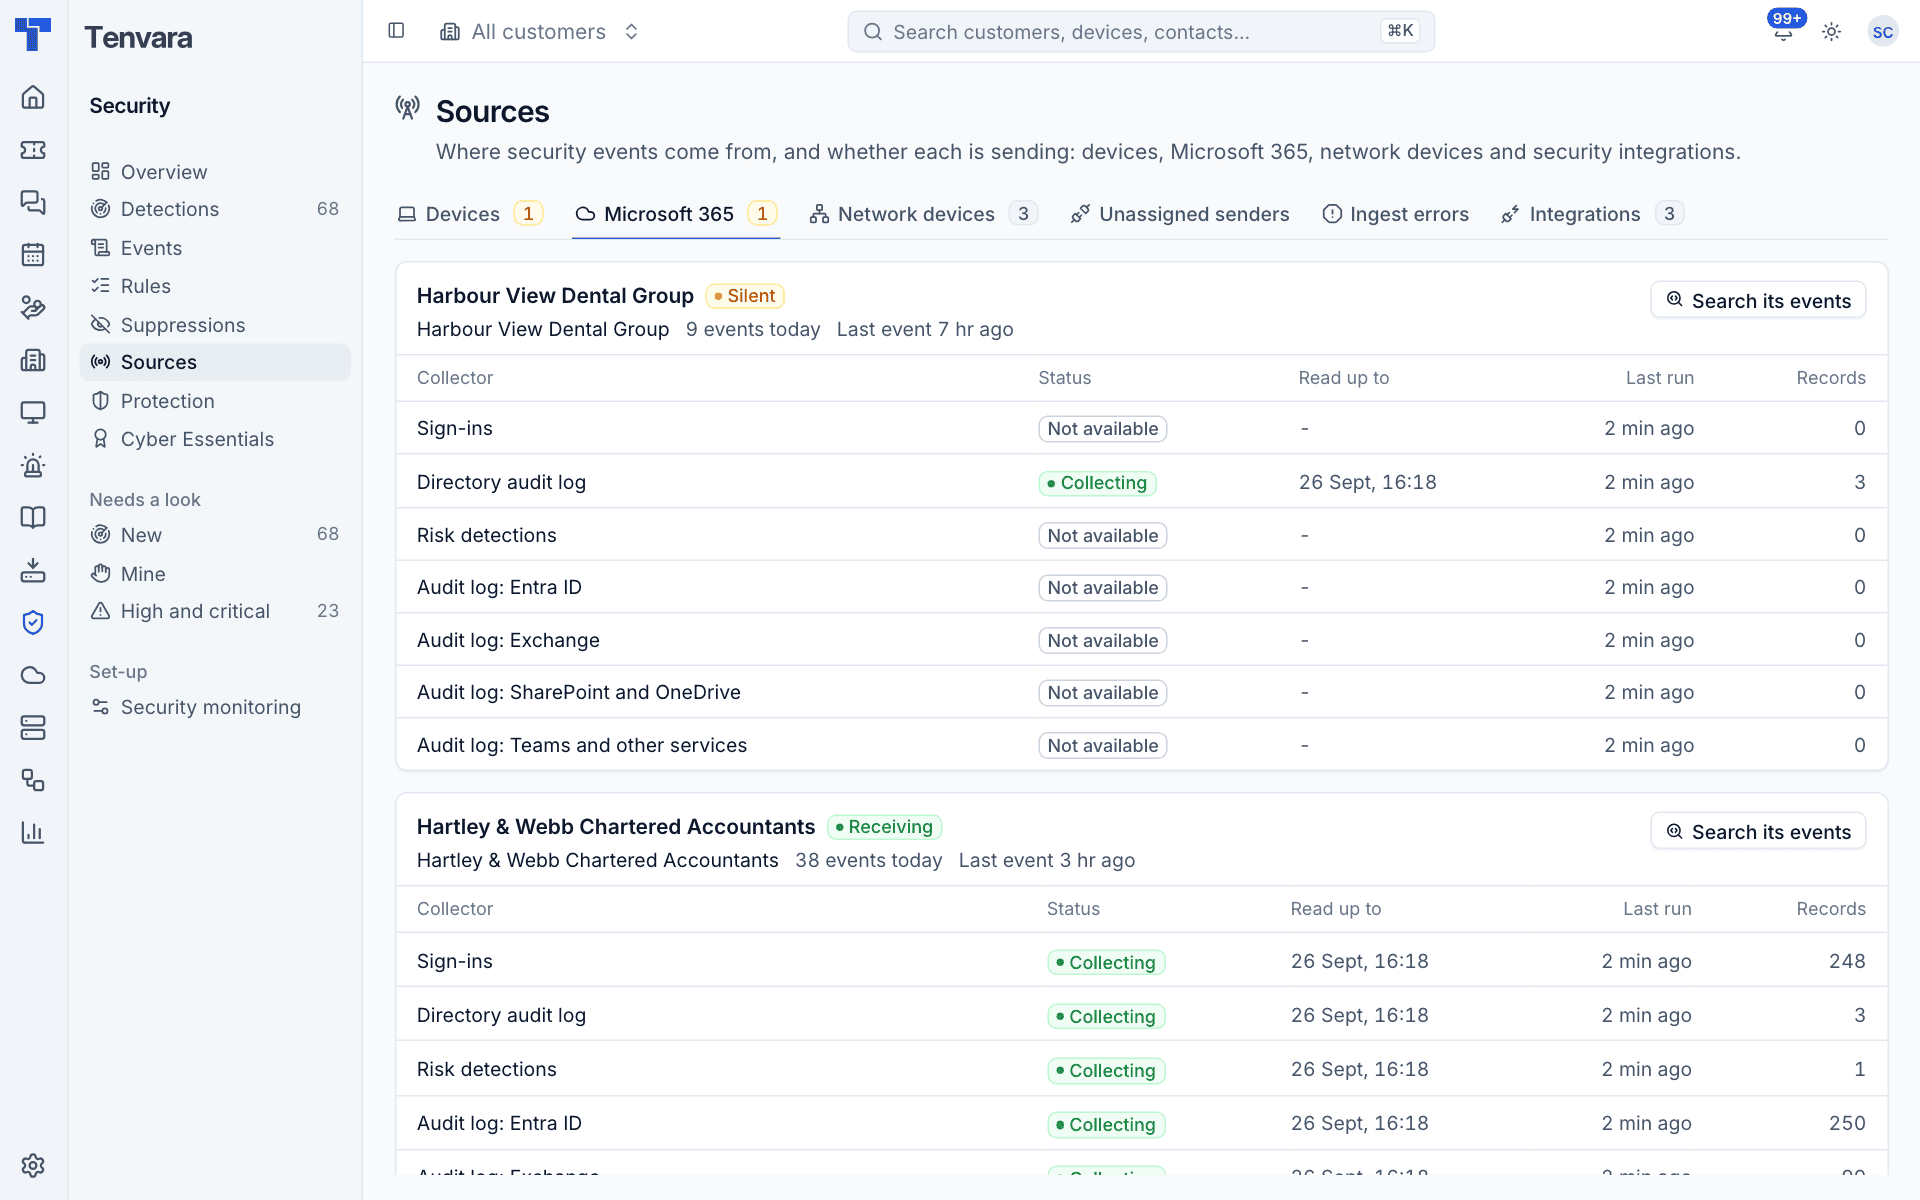
A stream that shows Not available is missing something on Microsoft's side: sign-ins need Entra ID P1, risk detections need Entra ID P2, and the audit log streams need the tenant's unified audit log switched on. A missing permission on the app registration is named so you can add it. Tenvara reads Microsoft 365 every five minutes, and a late record is still picked up once it arrives.
What agents collect
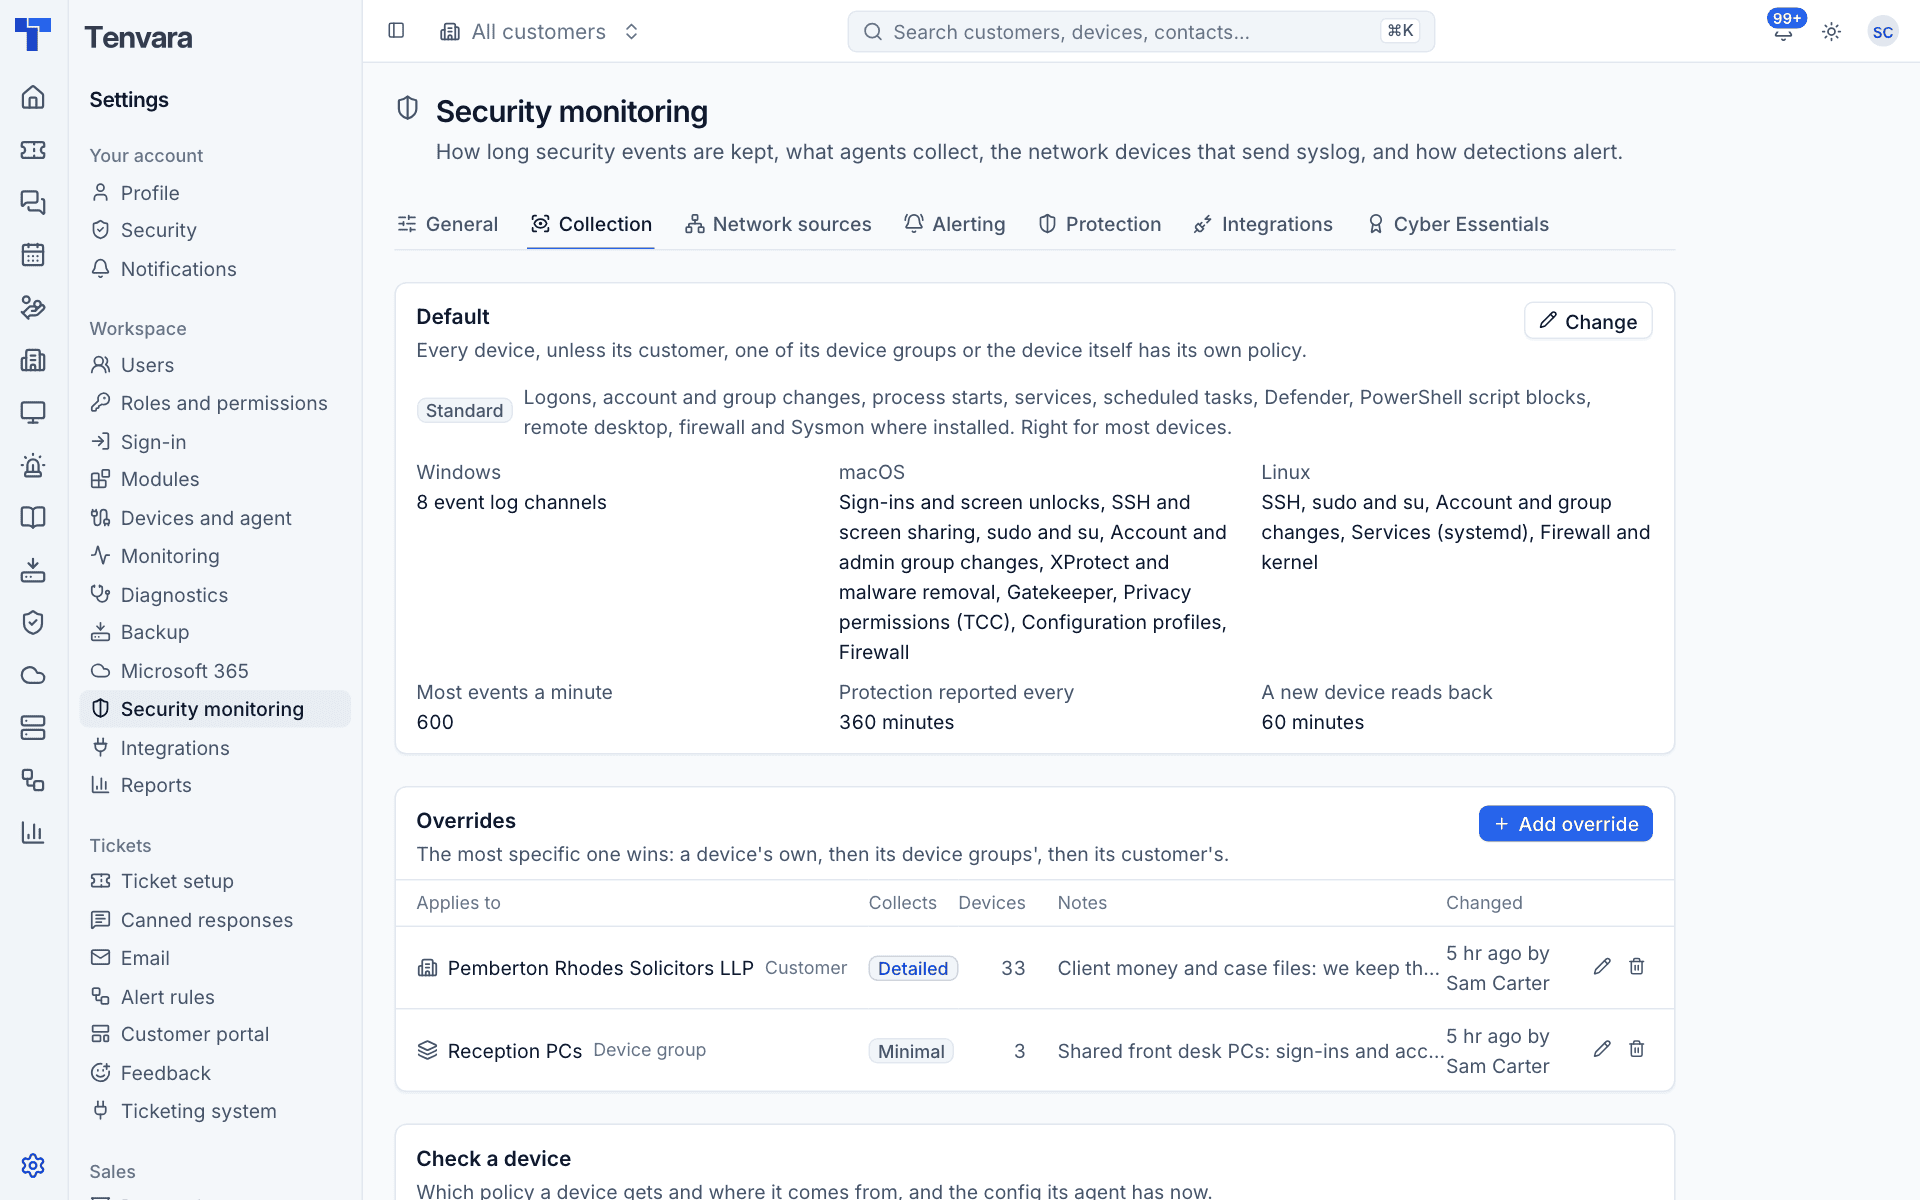
The agent's security module collects according to a collection policy. Go to Settings > Security monitoring > Collection.
| Policy | What it collects |
|---|---|
| Standard | Logons, account and group changes, process starts, services, scheduled tasks, Defender, PowerShell script blocks, remote desktop, firewall and Sysmon where installed; macOS sign-ins, SSH, sudo, accounts, XProtect, Gatekeeper, privacy permissions, profiles and firewall; Linux SSH, sudo, accounts, services and firewall. Right for most devices |
| Detailed | Standard plus more Windows events (Kerberos tickets, share access, more Sysmon), Task Scheduler and AppLocker, every macOS category, Linux audit and cron, and a higher rate limit |
| Minimal | Logons and account changes only, at a lower rate limit. For shared or low-risk machines |
| Off | Nothing is collected (protection reports carry on) |
| Custom | Your own choice of Windows channels and event ids, macOS and Linux categories, and limits |
Each policy also sets the most events a minute a device may send, how often protection is reported, and how soon a new device reads its settings.
Setting the policy
- Under Default, press Change to pick the policy every device gets unless something more specific applies.
- Under Overrides, press Add override to give a customer, a device group or one device its own policy, with a note saying why.
- The most specific wins: a device's own, then its device groups', then its customer's, then the default.
- Use Check a device to see which policy a device gets, where it comes from, and the settings its agent has now.
Changes reach agents automatically.
Network devices
Firewalls and gateways send their logs to Tenvara as syslog. Supported makes are UniFi, FortiGate, pfSense and OPNsense, SonicWall, WatchGuard and DrayTek, plus any device sending standard syslog.
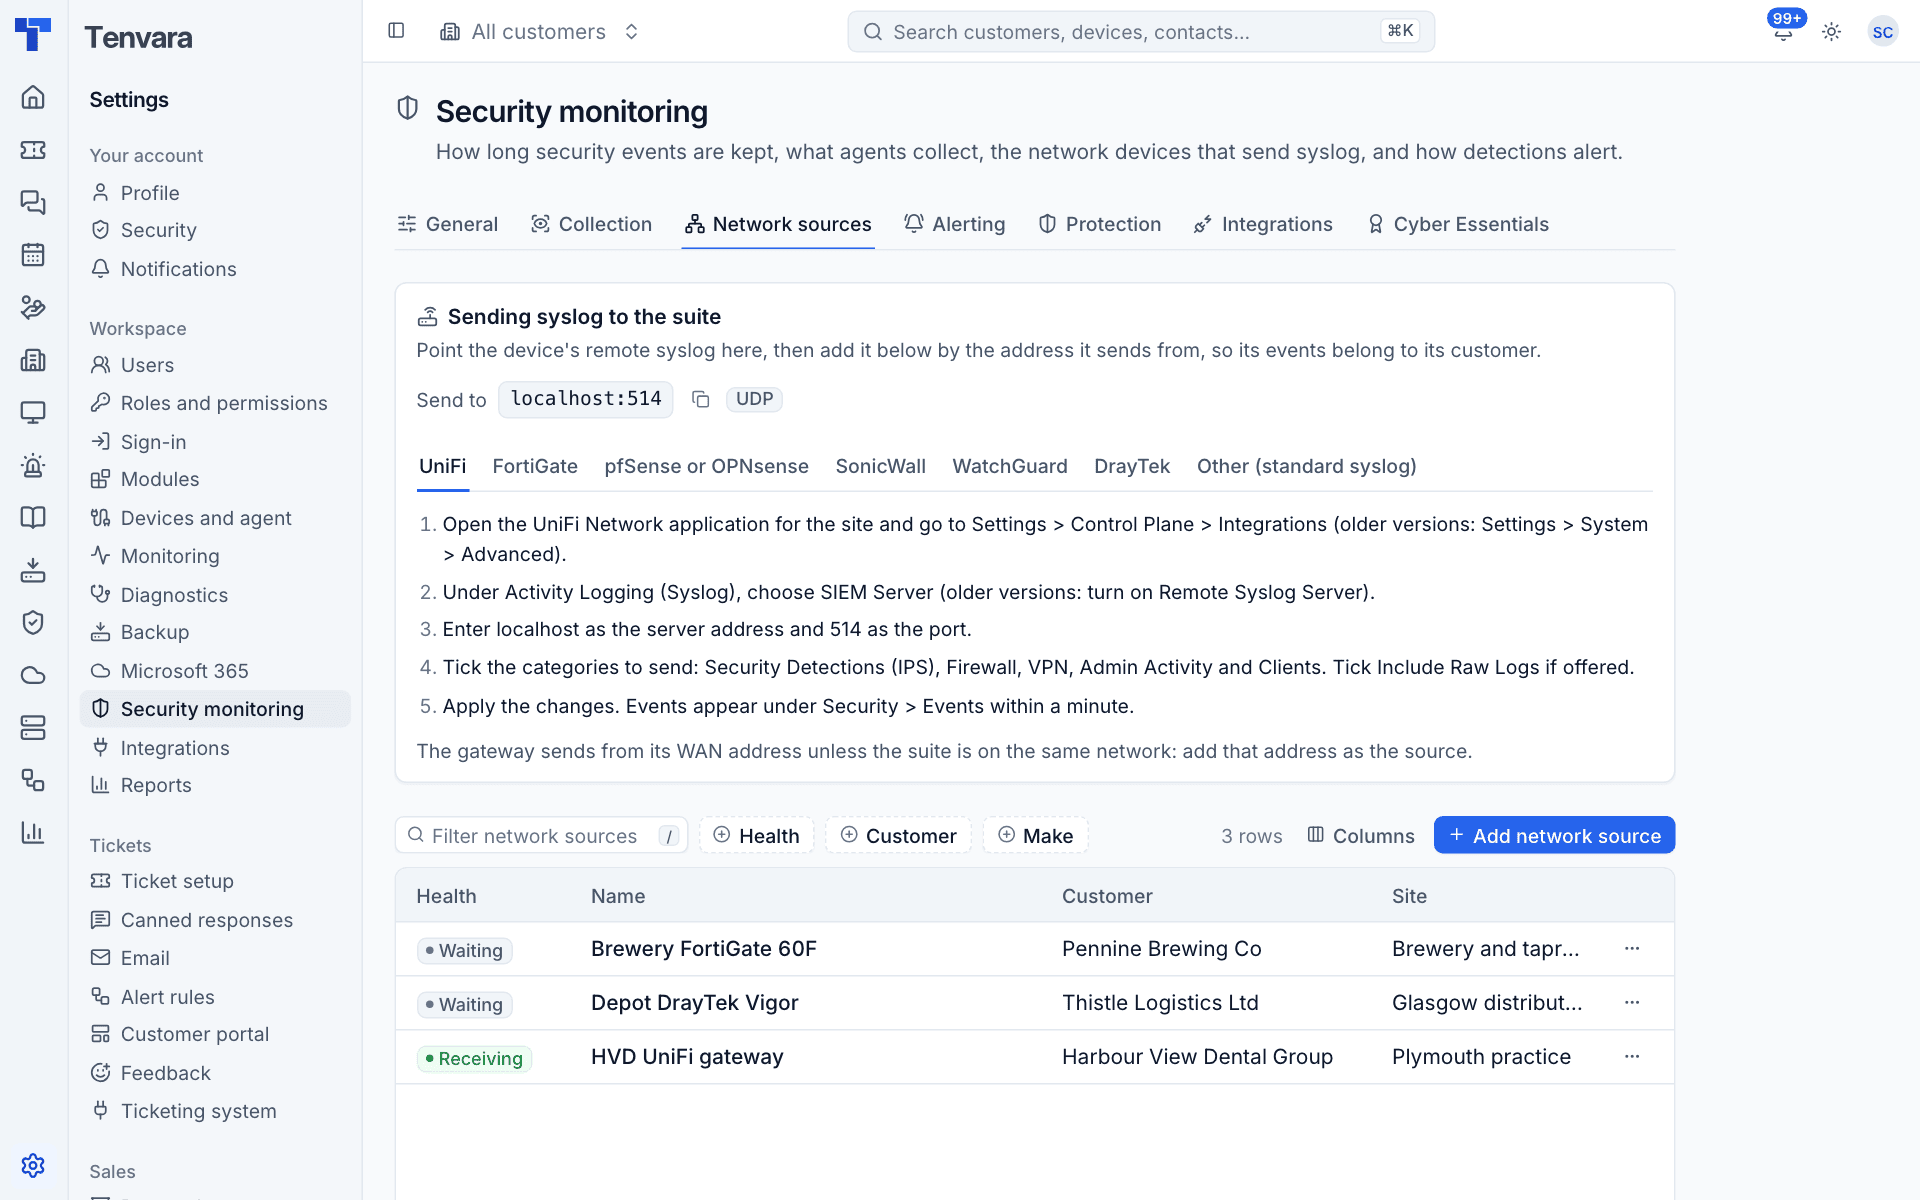
- Go to Settings > Security monitoring > Network sources. Send to shows the address, port and protocol to use.
- Choose the device's make to see step-by-step instructions for it (for example, in the UniFi Network application: Settings, Control Plane, Integrations, then SIEM Server).
- Point the device's remote syslog at that address.
- Press Add network source and enter a name, the Customer and Site, the address or range the device sends from (usually its WAN address), and the make. Optionally set its own silent limit.
- Events appear under Security > Events within a minute, and the source shows Receiving.
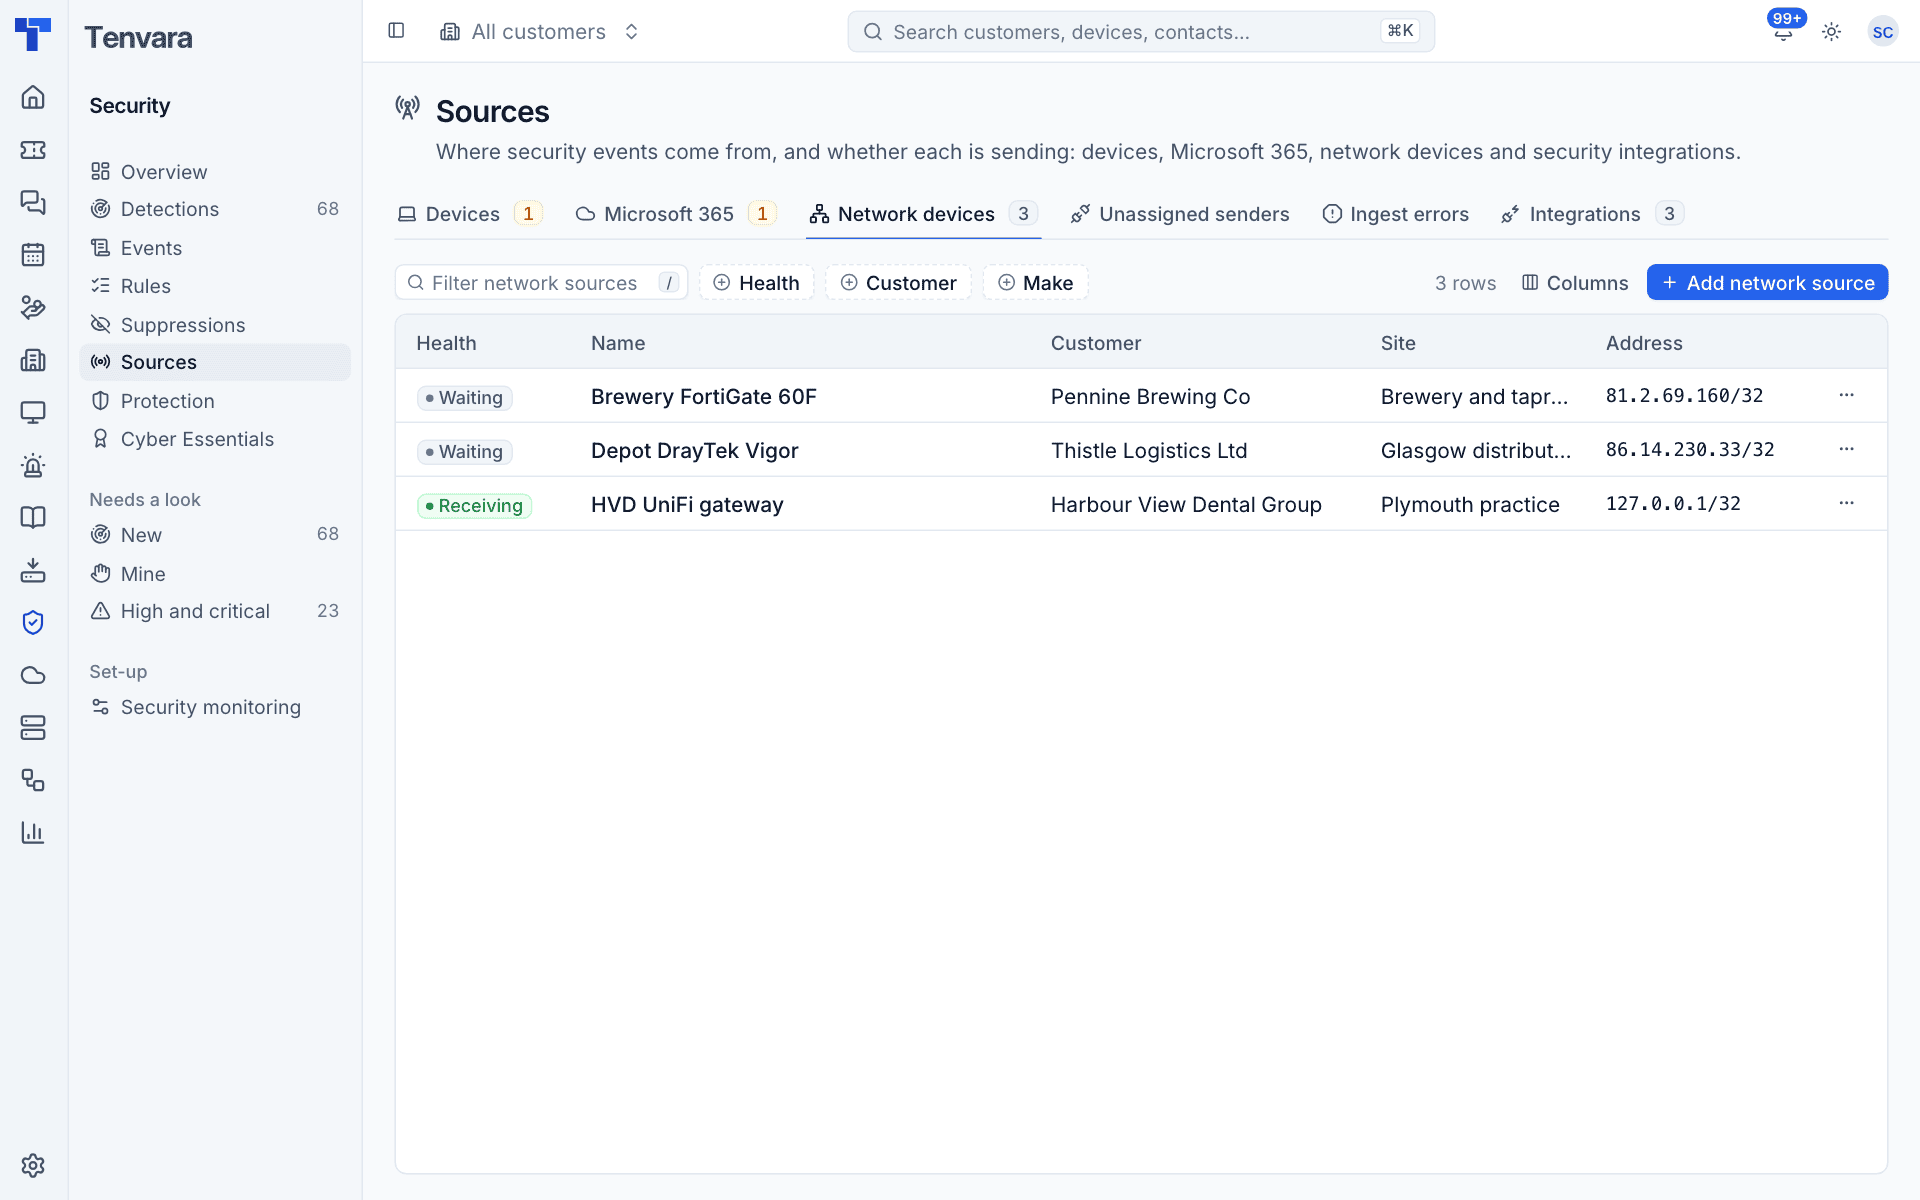
If a device starts sending before you add it, it shows under Unassigned senders with its address, event count and latest line. Assign it to a customer there to make the network source in one step.
General settings
Settings > Security monitoring > General (administrators) holds:
- How long events are kept: events (7 to 1,095 days, 90 by default), raw records (30 by default, never longer than events) and hourly counts (400 by default). Changes apply to what is already stored.
- Silent sources: the limits for devices, Microsoft 365 tenants and network devices, whether silent sources raise alerts, and at what severity.
- Events screen: the default time range and how often live tail looks for new events.
- Syslog address: the host, port and protocol shown in the network device instructions.
Was this page helpful?
Thanks for the feedback.