Finding your way around
The rail, the sidebar, the top bar, the command palette, keyboard shortcuts and the home page.
Every screen in Tenvara has the same frame: a rail of areas down the left, a sidebar for the area you are in, and a top bar with search, notifications and your account. Once you know these, every area works the same way.
The rail
The narrow column on the far left holds one icon per area: Home, Tickets, Chat, Schedule, Sales, Customers, Devices, Alerts, Docs, Backup, Security, Microsoft 365, Infrastructure, Automation and Reports, with Settings at the bottom. Hover an icon to see its name.
An area only shows when its module is switched on in Modules and your role lets you see it (see Roles and permissions). If a colleague has an icon you do not, that is why.
The sidebar
Next to the rail, each area has a sidebar with its own pages and saved views. For example, Tickets lists views such as My open tickets, Unassigned and SLA breached, and Settings lists every settings page grouped by what it affects. Press the sidebar button at the left of the top bar to hide or show it and give the page more room.
The top bar
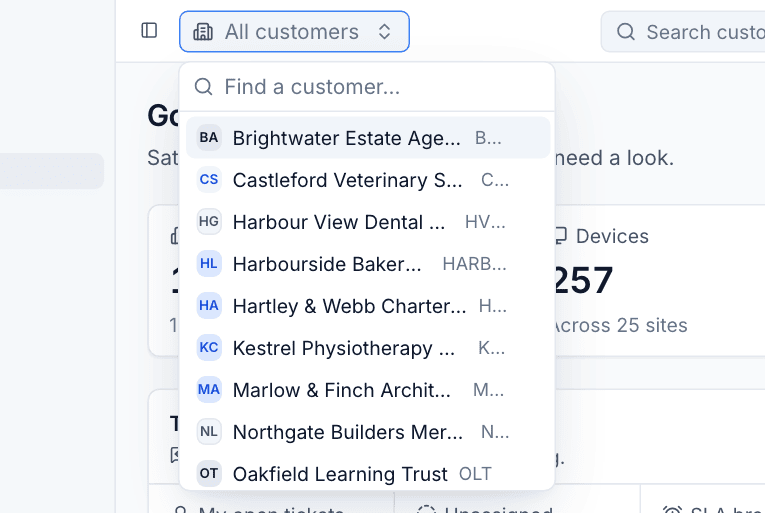
From left to right:
- Customer scope (showing All customers): pick one customer to focus the app on them. Type in Find a customer... to narrow the list, and choose All customers to go back.
- Search (Search customers, devices, contacts...): opens the command palette, described below. The shortcut is
Cmd+Kon a Mac andCtrl+Kon Windows and Linux. - Notifications: your inbox, with a count of unread items.
- Change theme: switches between light and dark.
- Account: your initials. Opens the account menu.
The notification inbox
The bell opens your inbox. It keeps a copy of every notification sent to you, whatever else you have chosen: tickets assigned to you, customer replies, SLA warnings, chats waiting, critical alerts, on-call pages and messages from automation rules. Switch between All and Unread, open an item to go straight to what it is about, and use the tick button to mark everything as read.
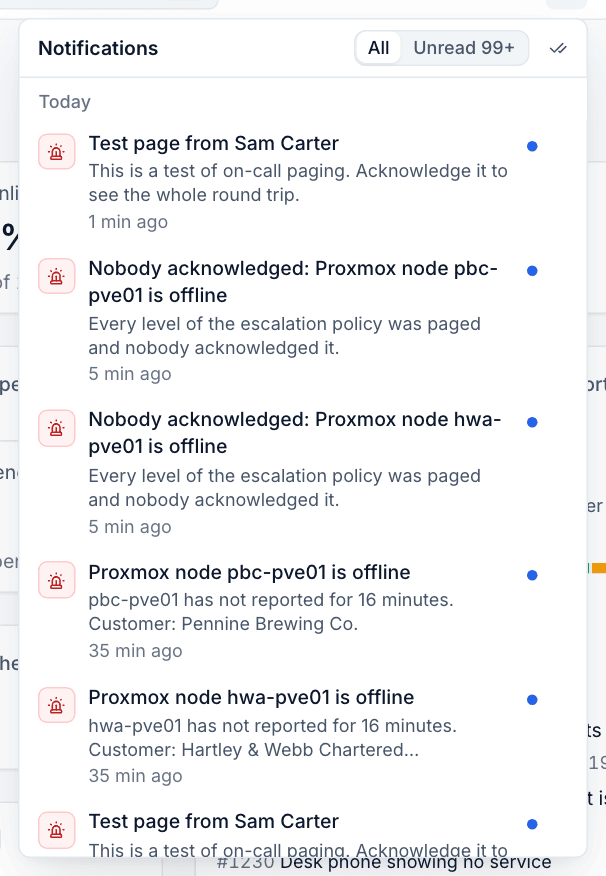
Where else notifications reach you (email, Teams, Slack or text) and when to hold them back is up to you in Your profile, security and notifications.
The account menu
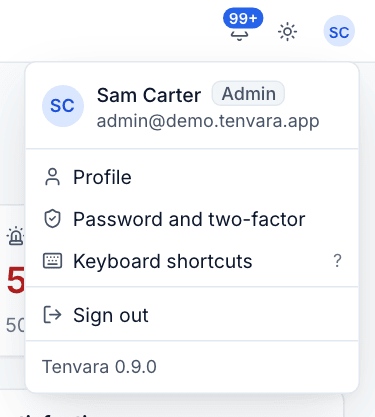
The account menu shows your name, role and email, and has:
- Profile: your name and how you sign in.
- Password and two-factor: change your password and set up two-factor.
- Keyboard shortcuts (or press
?): every shortcut on the current screen. - Sign out.
The version of Tenvara you are running is shown at the bottom of the menu. Quote it when you contact support.
The command palette
Press Cmd+K (or Ctrl+K), or click the search box, to open the command palette. It is the quickest way to get anywhere.
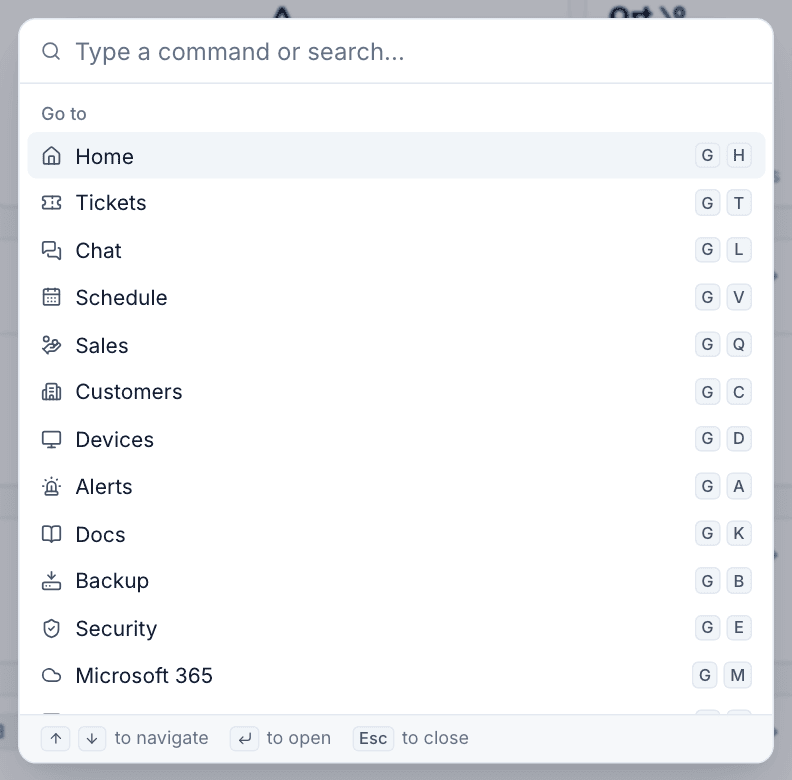
With nothing typed it lists Go to destinations: every area, plus the views and pages inside them, such as Tickets: Unassigned, Patches: waiting for approval, Certificates or Microsoft 365: findings. Start typing to search everything you are allowed to see at once: customers, contacts, sites, devices, tickets, chats, printers, documentation records, articles and credentials, grouped by type.
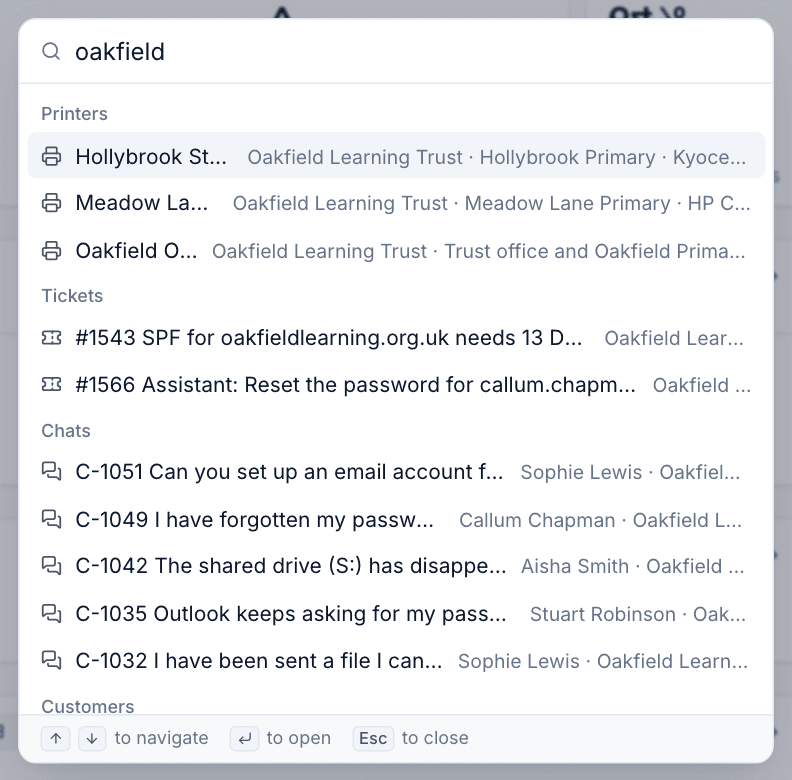
- Press
Cmd+K. - Type part of a name, a ticket number or a hostname.
- Use the up and down arrows to pick a result, and press
Enterto open it.Esccloses the palette.
Some areas add actions to the palette too. For example, Infrastructure lets you start or shut down a Proxmox guest from it. Permissions always apply: the palette never shows anything you could not open yourself.
Keyboard shortcuts
The letters next to each Go to entry are shortcuts you can use anywhere without opening the palette. Press G, then the letter:
| Keys | Goes to |
|---|---|
G H |
Home |
G T |
Tickets |
G L |
Chat |
G V |
Schedule |
G Q |
Sales |
G C |
Customers |
G D |
Devices |
G A |
Alerts |
G K |
Docs |
G B |
Backup |
G E |
Security |
G M |
Microsoft 365 |
G I |
Infrastructure |
G R |
Reports |
G S |
Settings |
Lists have their own shortcuts, for example / to jump to the filter box. Press ? on any screen to see what it offers.
The home page
Home is the first thing you see after signing in. It greets you, says how many open alerts need a look, and sums up the whole business on one page:
- Customers, Devices, Online now and Open alerts across the top.
- Tickets: tickets with a customer reply waiting, My open tickets, Unassigned, SLA breached and Opened today, each a link to that view.
- Chats waiting: who is waiting in chat, with a link to the console.
- Today's visits: your visits or everyone's, with a link to Dispatch.
- On-call and automation: pages waiting to be acknowledged, who is on call, and failed rule runs.
- Customer satisfaction, Security detections, Customer health, Device health and Needs attention lower down.
Cards only appear for the modules you use, so a team without scheduling will not see Today's visits. Every figure is a link to the list behind it.
Was this page helpful?
Thanks for the feedback.