Diagnostics
Run read-only diagnostics on a device to see what is using it, recent crashes, stopped services, the network, protection and battery, in seconds.
Diagnostics is a set of read-only checks the agent runs when you ask. In a few seconds it tells you what is using the processor and memory, how full and healthy the disks are, what starts with the machine, which services are stopped, how the network is behaving, recent crashes and errors, the state of antivirus and firewall, and the battery. Nothing on the device changes, and the user is not interrupted.
Diagnostics comes with monitoring: people who can view monitoring see the results, and people who can manage monitoring can run it.
Run diagnostics
- Open the device.
- Click Run diagnostics in the Diagnostics section, or choose it from the ... menu, or use
Cmd+Kand type Run diagnostics on and the device name. - Progress shows as each probe finishes. A full run usually takes a few seconds.
If a run for the device is already under way, asking again shows that run rather than starting another. A recent run (within five minutes by default) is reused by the device page and by AI assist instead of running again.
What stands out
The Diagnostics section on the device page shows when it last ran and who ran it, then the findings worth a look, and a line of quick facts: how long it has been up, memory in use, the fullest disk and crashes today.
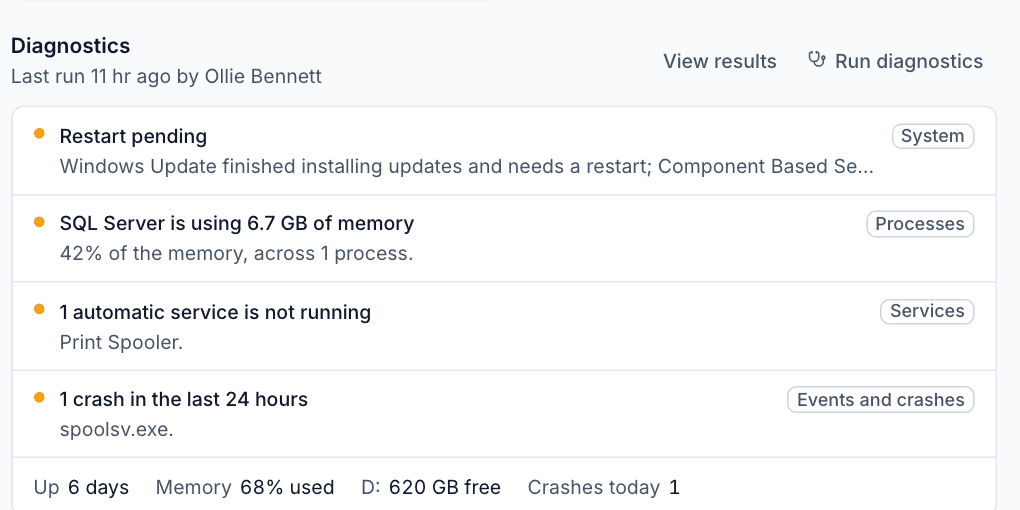
Findings include low or failing disks, a pending or overdue restart, memory running short, one app using a large share of memory or processor, automatic services that are not running, crashes and critical events, antivirus off or out of date, the firewall off, a worn battery, a slow or lossy network, slow name lookups, and any probe that could not read the machine.
The full results
Click View results to open the full results.
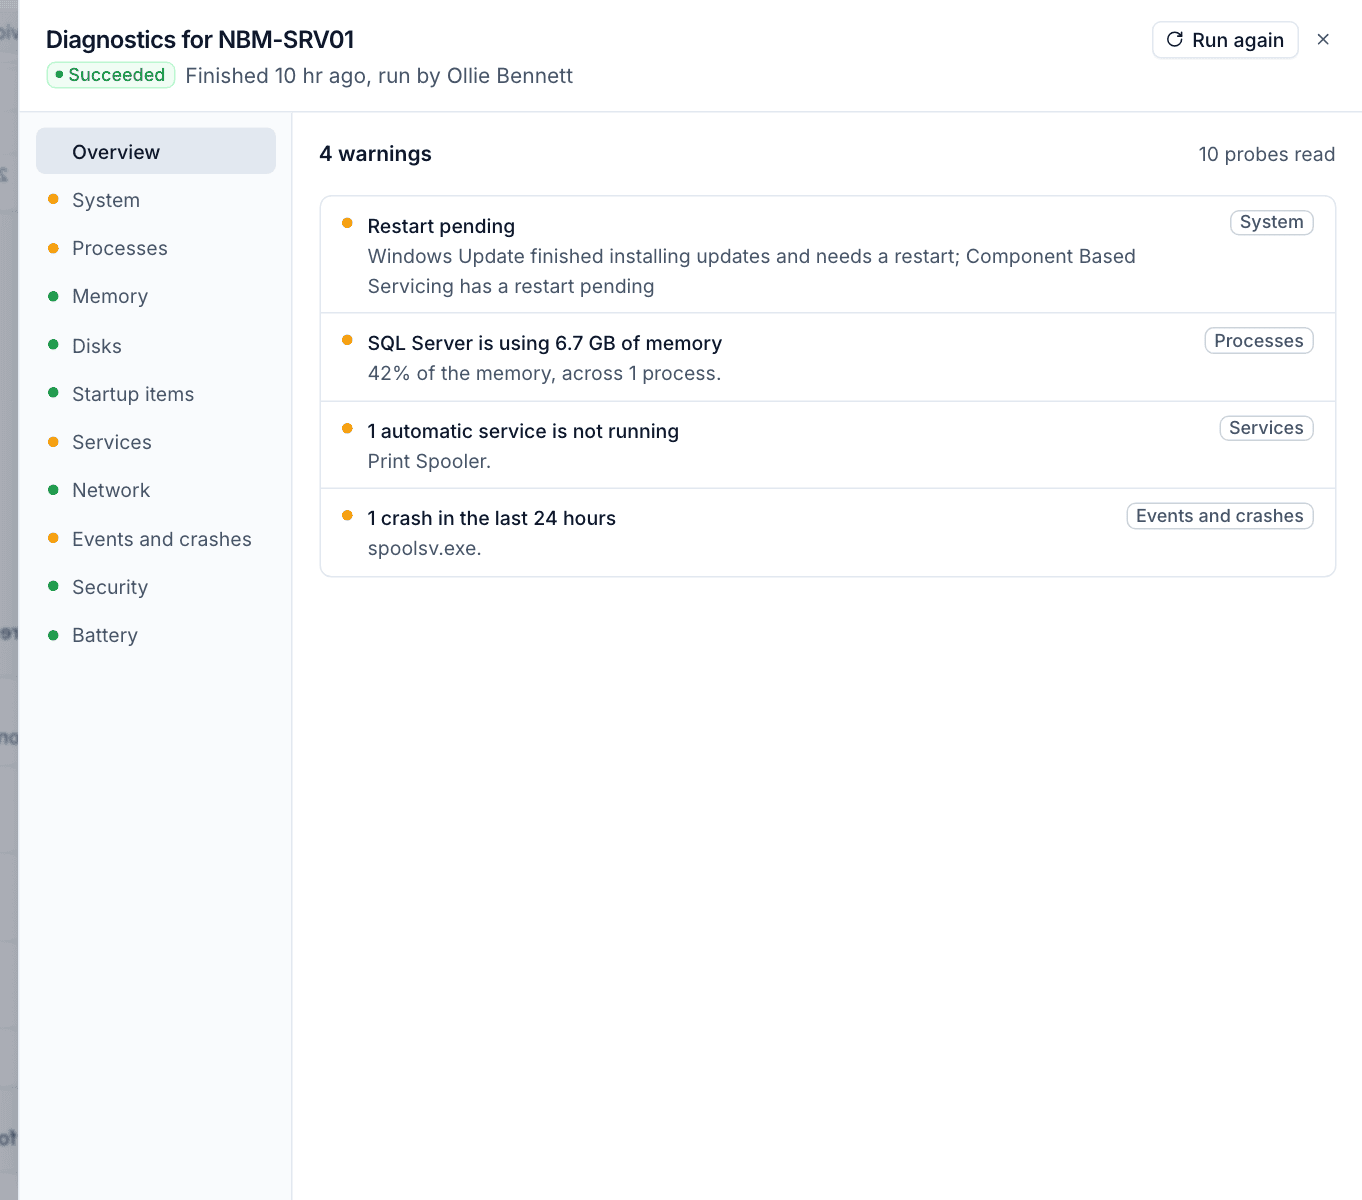
The list on the left has a dot for how each probe came out. Overview lists the findings; the other entries show each probe's detail:
| Probe | What it shows |
|---|---|
| System | Operating system and build, uptime, last boot, and whether a restart is pending and why. |
| Processes | The busiest apps and processes by processor, memory and disk, grouped by app. |
| Memory | Memory and swap in use, and the memory pressure the operating system reports. |
| Disks | Every volume with its free space, and each physical disk's health where the system reports it. |
| Startup items | What starts with the machine or at sign-in. |
| Services | Automatic services that are not running (ignoring ones that stop by design). |
| Network | Adapters, gateway and DNS servers, pings to the gateway and a public host, and a name lookup. |
| Events and crashes | Errors, critical events and crashes over the last day and week, grouped, with the latest. |
| Security | Antivirus status and signature age, and the firewall. |
| Battery | Charge, health against design capacity and cycle count on laptops. |
Use Run again to take a fresh reading, and compare with earlier runs from the results panel.
Note: The network probe is the only one that sends anything: four pings each to the gateway and the public host, and one name lookup. Command lines and log messages are scrubbed of anything that looks like a password or token before they leave the device.
Settings
Settings > Diagnostics sets what the network probe measures and when a reading counts as worth a look.
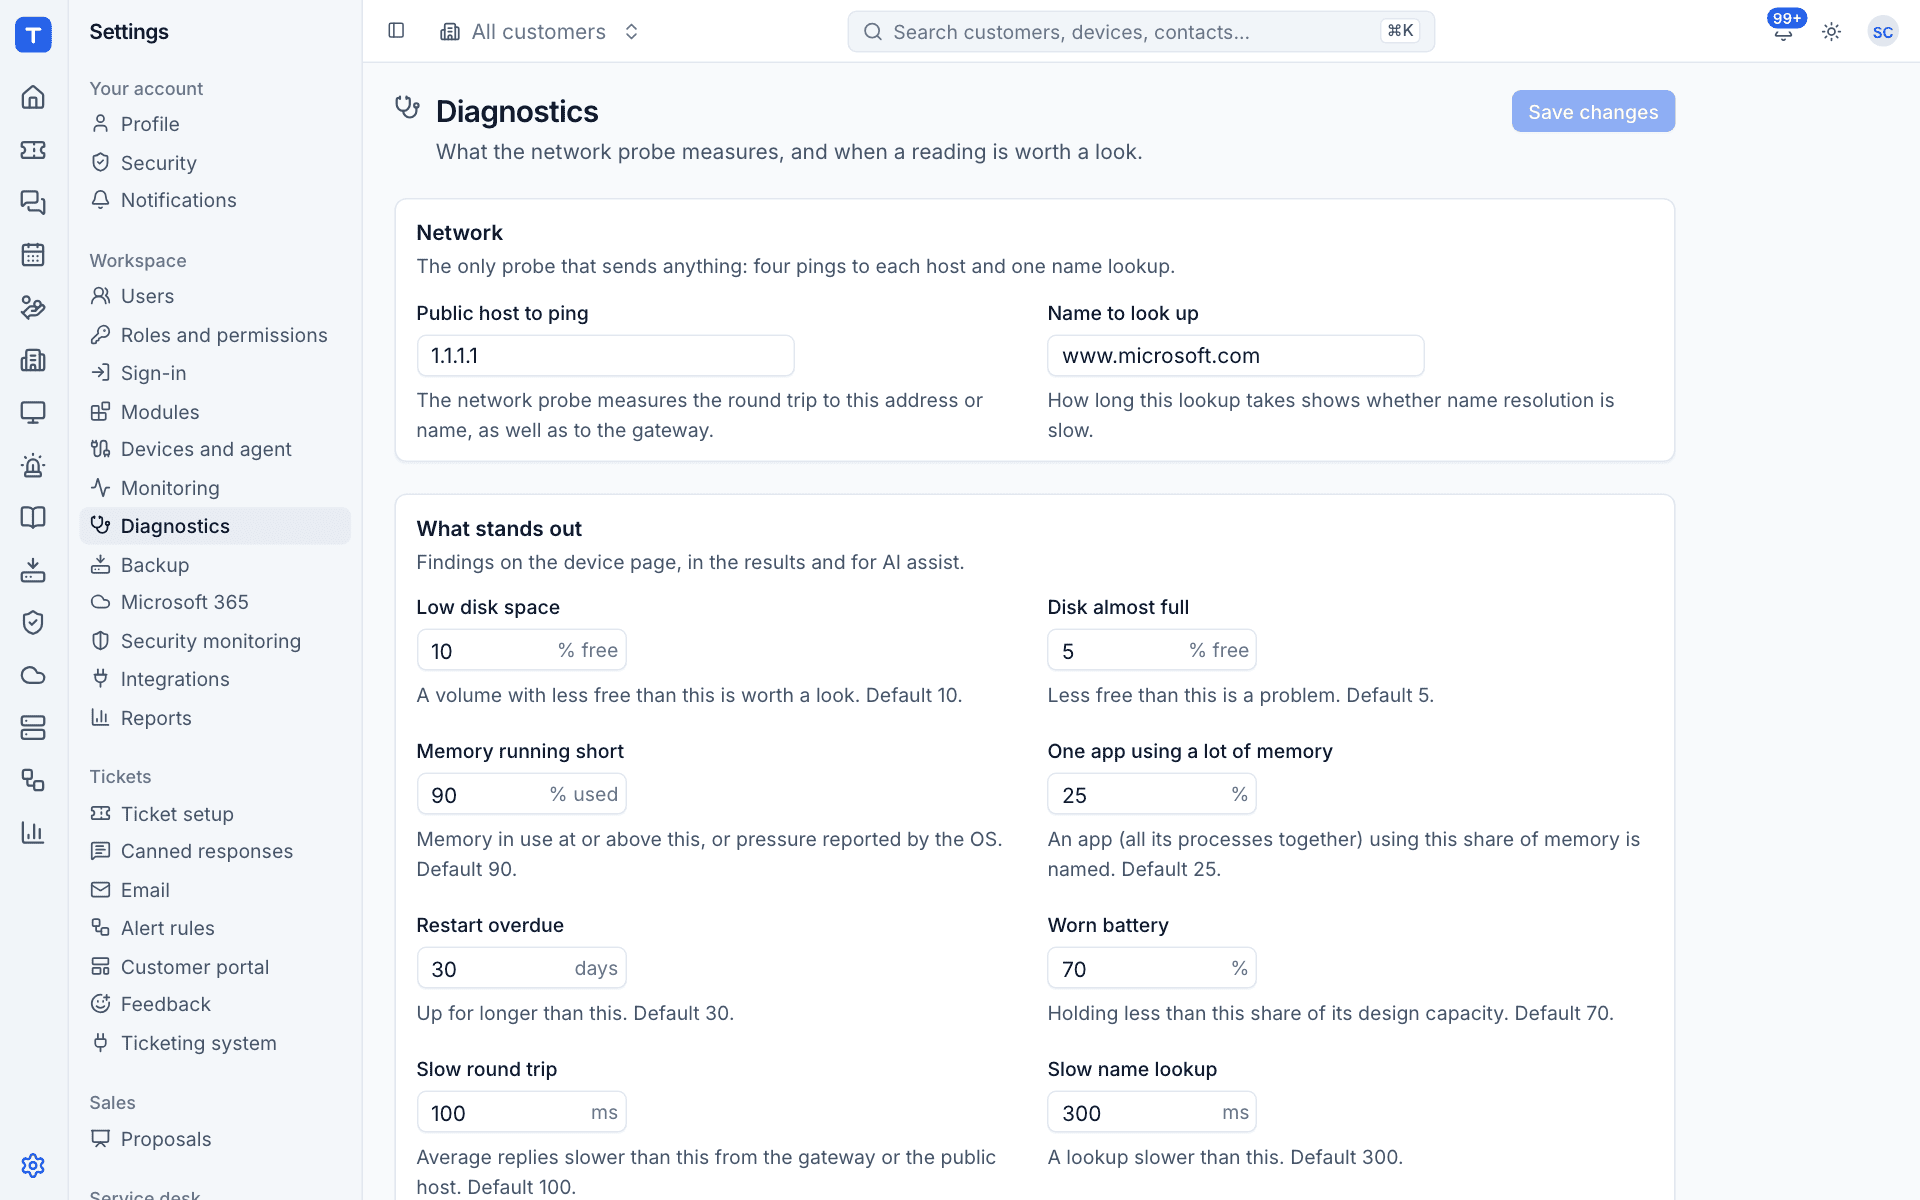
| Setting | Default |
|---|---|
| Public host to ping | 1.1.1.1 |
| Name to look up | www.microsoft.com |
| Low disk space | less than 10% free |
| Disk almost full | less than 5% free |
| Memory running short | 90% used, or pressure reported by the operating system |
| One app using a lot of memory | 25% of memory |
| Restart overdue | up for more than 30 days |
| Worn battery | holding less than 70% of its design capacity |
| Slow round trip | slower than 100 ms |
| Slow name lookup | slower than 300 ms |
| Results count as current for | 300 seconds |
These thresholds decide the findings on the device page, in the results and for AI assist. For continuous monitoring and alerts, see Monitoring and alerts.
Was this page helpful?
Thanks for the feedback.