Policies, checks and thresholds
Create monitoring policies for customers, groups and devices, add service, process, ping, port, web and event log checks, and set alert thresholds.
Monitoring policies live in Settings > Monitoring, listed in the order they apply: the global default, customer policies, device group policies, device overrides, then any policy not assigned anywhere. Each shows what it changes, where it applies, its checks, thresholds and windows, and how many devices it reaches. See How monitoring works for how they combine.
Warning: Managing monitoring decides what every monitored device runs, as SYSTEM or root. Give the Monitoring manage permission only to people you would trust with that.
Create a policy
- Go to Settings > Monitoring and click New policy.
- Give it a Name and, if you like, a Description.
- Set a Priority. At one level, the higher priority wins.
- Choose where it applies: Customers (every device of these customers) and Device groups (every device in these groups). A policy assigned nowhere does nothing until you assign it.
- Save, then set what the policy changes (below).
Device overrides are made for you the first time you change a check or threshold for one device from its page, and are listed under Device overrides.
Settings
Open a policy to edit it. In any policy but the global default, tick Set beside a setting to change it here; leave it as Inherited to take it from less specific policies. Save with Save changes or Cmd+S.
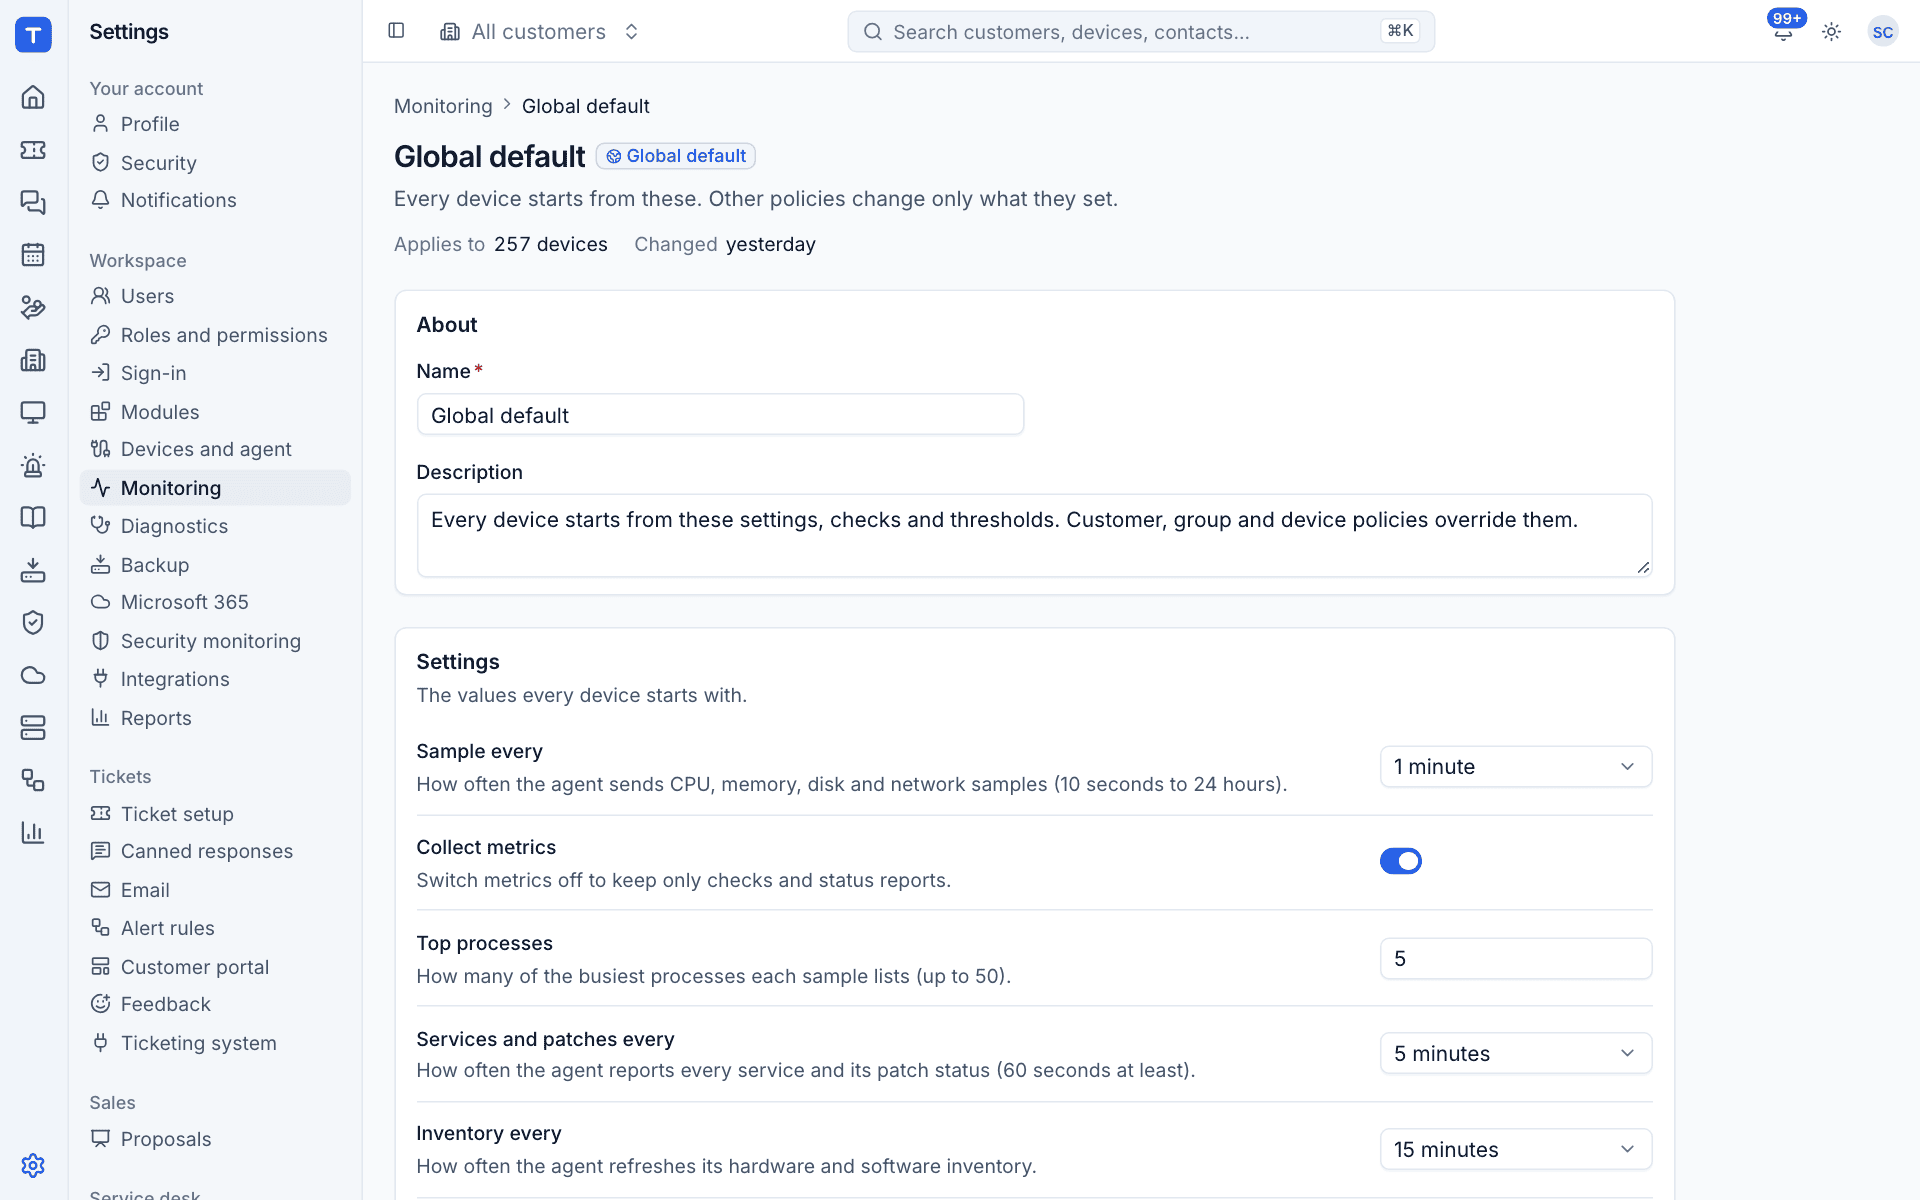
| Setting | What it does |
|---|---|
| Sample every | How often the agent sends CPU, memory, disk and network samples (10 seconds to 24 hours). |
| Collect metrics | Switch off to keep only checks and status reports. |
| Top processes | How many of the busiest processes each sample lists (up to 50). |
| Services and patches every | How often the agent reports every service and its patch status (60 seconds at least). |
| Inventory every | How often the agent refreshes its hardware and software inventory. |
| Offline after | Minutes without hearing from the device before it counts as offline. |
| Offline alerts | Raise an alert when the device goes offline. Workstations that go home at night usually have this off. |
| Offline alert severity | Info, Warning or Critical. |
Checks, thresholds and windows save as you change them, and switching one on or off takes effect straight away. Changes reach the agents within moments.
Checks
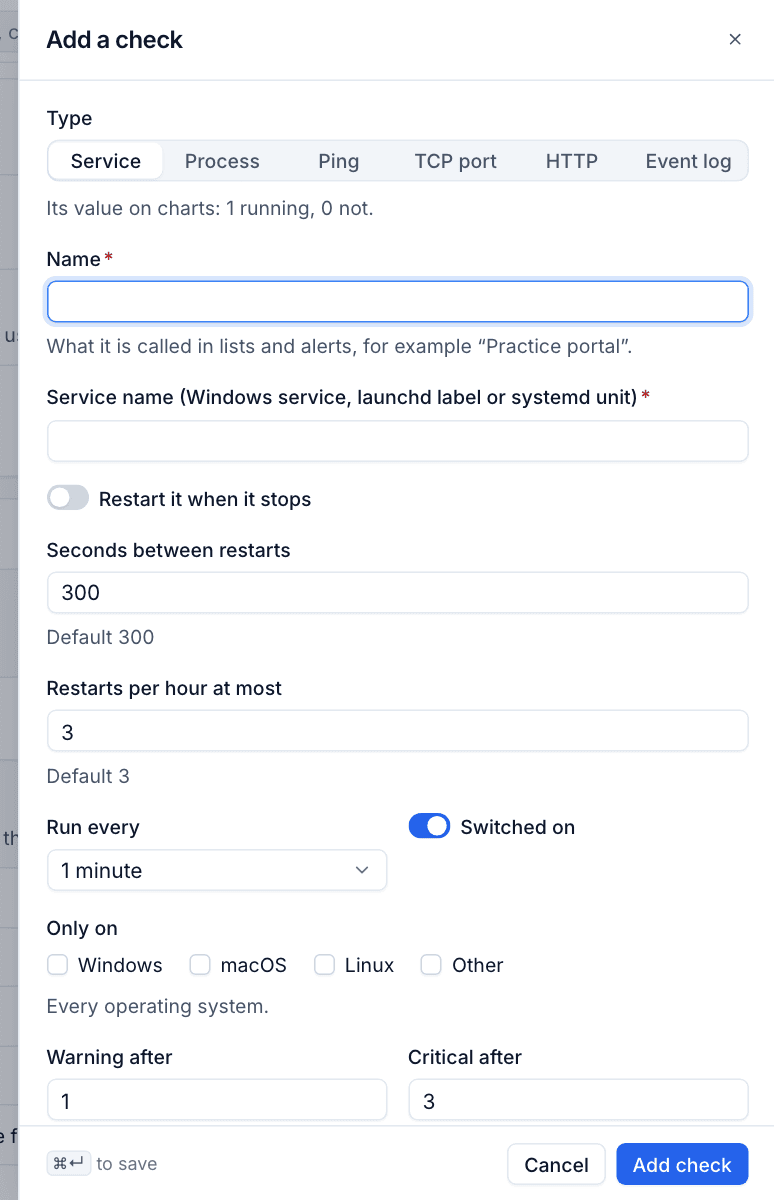
Checks are things the agent tests on every device the policy reaches. Click Add check and choose the Type:
| Type | What it checks | Options |
|---|---|---|
| Service | A Windows service, launchd label or systemd unit is running. | Restart it when it stops, with seconds between restarts and a maximum per hour. |
| Process | A process is running. | At least this many running. |
| Ping | A host answers ping. | Pings per check, timeout. |
| TCP port | A port accepts connections. | Host, port, timeout. |
| HTTP | A web address answers as expected. | Method (GET, HEAD or POST), expected status codes, text the response contains, timeout, Check the certificate. |
| Event log | Matching events appeared recently. | Log (Windows) or unit (Linux), sources, event IDs, levels, look back in minutes. |
For every check you also set:
- A Name, as it appears in lists and alerts, for example Practice portal.
- Run every, from 30 seconds to an hour, and whether it is Switched on.
- Only on: limit it to Windows, macOS, Linux or Other. Leave all unticked for every operating system.
- Warning after so many failures in a row, and Critical after (leave empty for never critical).
- A Key. A check with the same key in a more specific policy replaces this one. It is made from the name unless you change it.
An HTTPS check also reports how many days its certificate has left, which the certificate thresholds use.
Note: For safety, ping, port and HTTP checks refuse link-local and cloud metadata addresses, and the agent refuses them too.
Thresholds
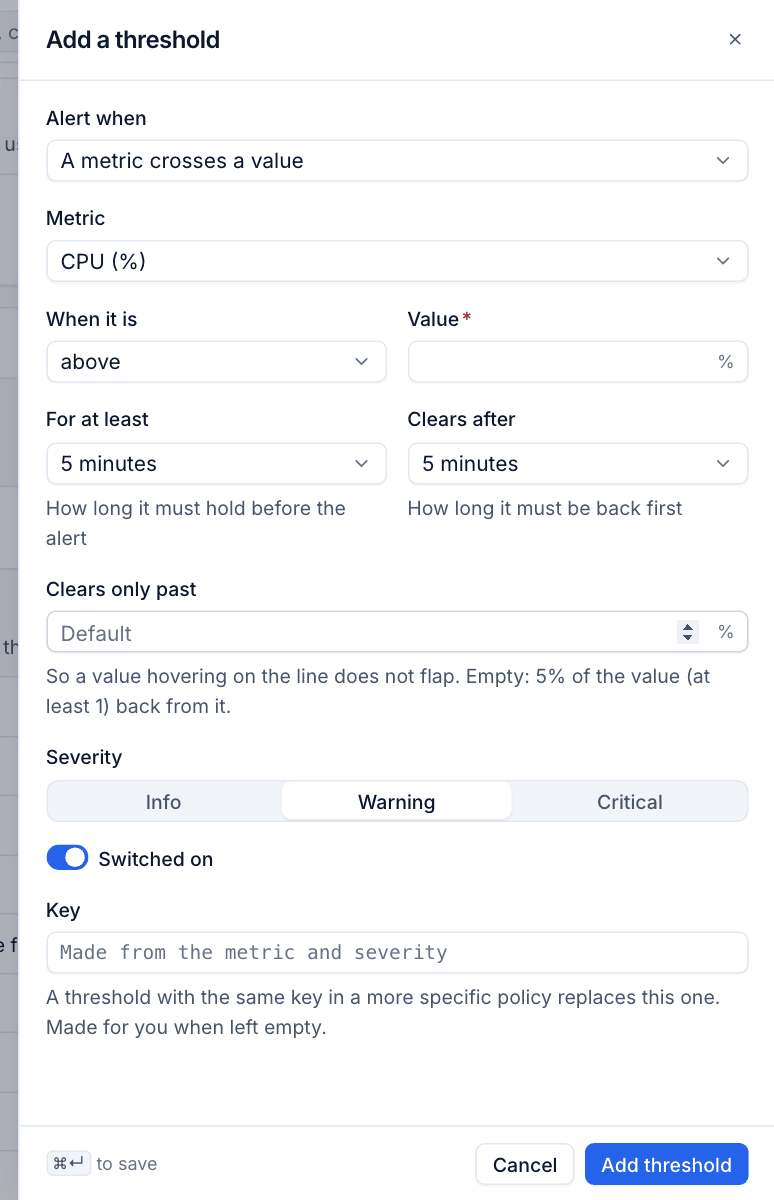
Thresholds say when data becomes an alert. Click Add threshold and choose what to alert on:
| Alert when | Settings |
|---|---|
| A metric crosses a value | The Metric (CPU, load, memory, swap, processes, disk used or free, disk reads and writes, network in and out, receive and send errors, temperature), above, at or above, below or at or below, the Value, For at least and Clears after. |
| A service is not running | The services to watch, and for how long. |
| Critical updates pending for days | How many days. |
| Reboot needed for days | How many days. |
| Certificate expiring within days | How many days (from HTTPS checks). |
Then choose the Severity (Info, Warning or Critical), whether it is Switched on, and its Key.
- Clears only past stops a value hovering on the line from flapping. Left empty, a metric must come back 5% of the threshold (at least 1) before the alert clears.
- Thresholds on the same thing share one alert. Disk C: at 86% opens a warning; at 96% the same alert turns critical; back at 90% it is a warning again.
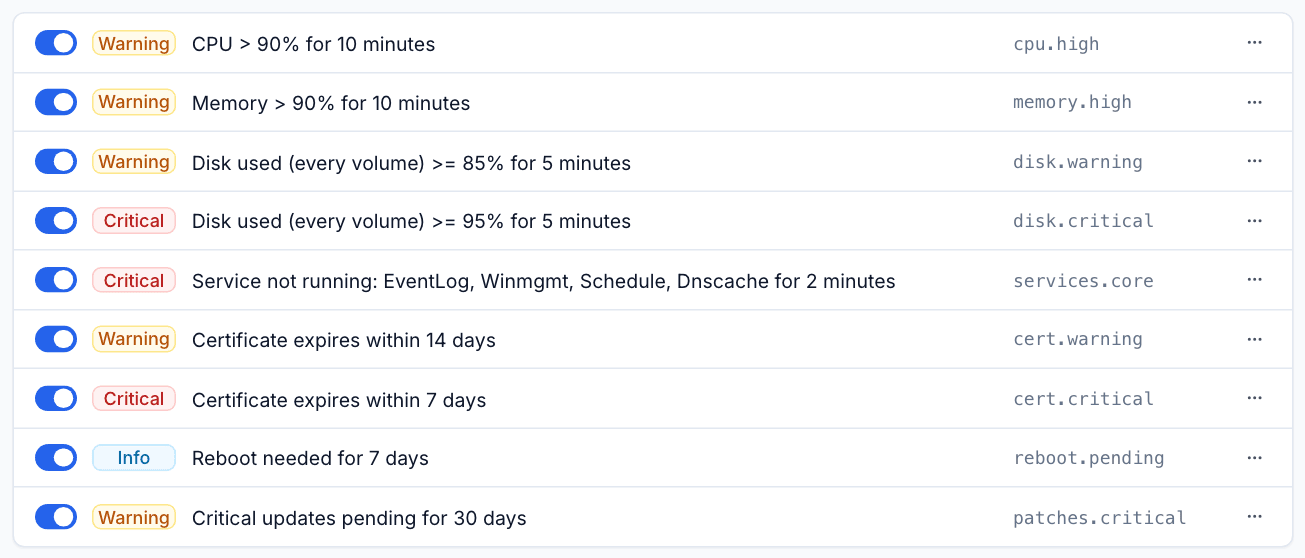
Use the switch on a row to turn a check or threshold off, and the ... menu to edit or delete it. Deleting or switching off a rule resolves its open alerts, because the rule has gone. If another rule of the same family still applies (for example a warning left when you delete the critical), it takes over at once.
Changing one device
To change a check or threshold for a single device, open the device and click Config on its Monitoring card. Change or switch off an inherited one, or add new ones; Tenvara stores the change in the device's own override policy. See Device health.
Was this page helpful?
Thanks for the feedback.