Alerts
Work the alert list across every source, read an alert with the chart around when it fired, and acknowledge, resolve or mute it.
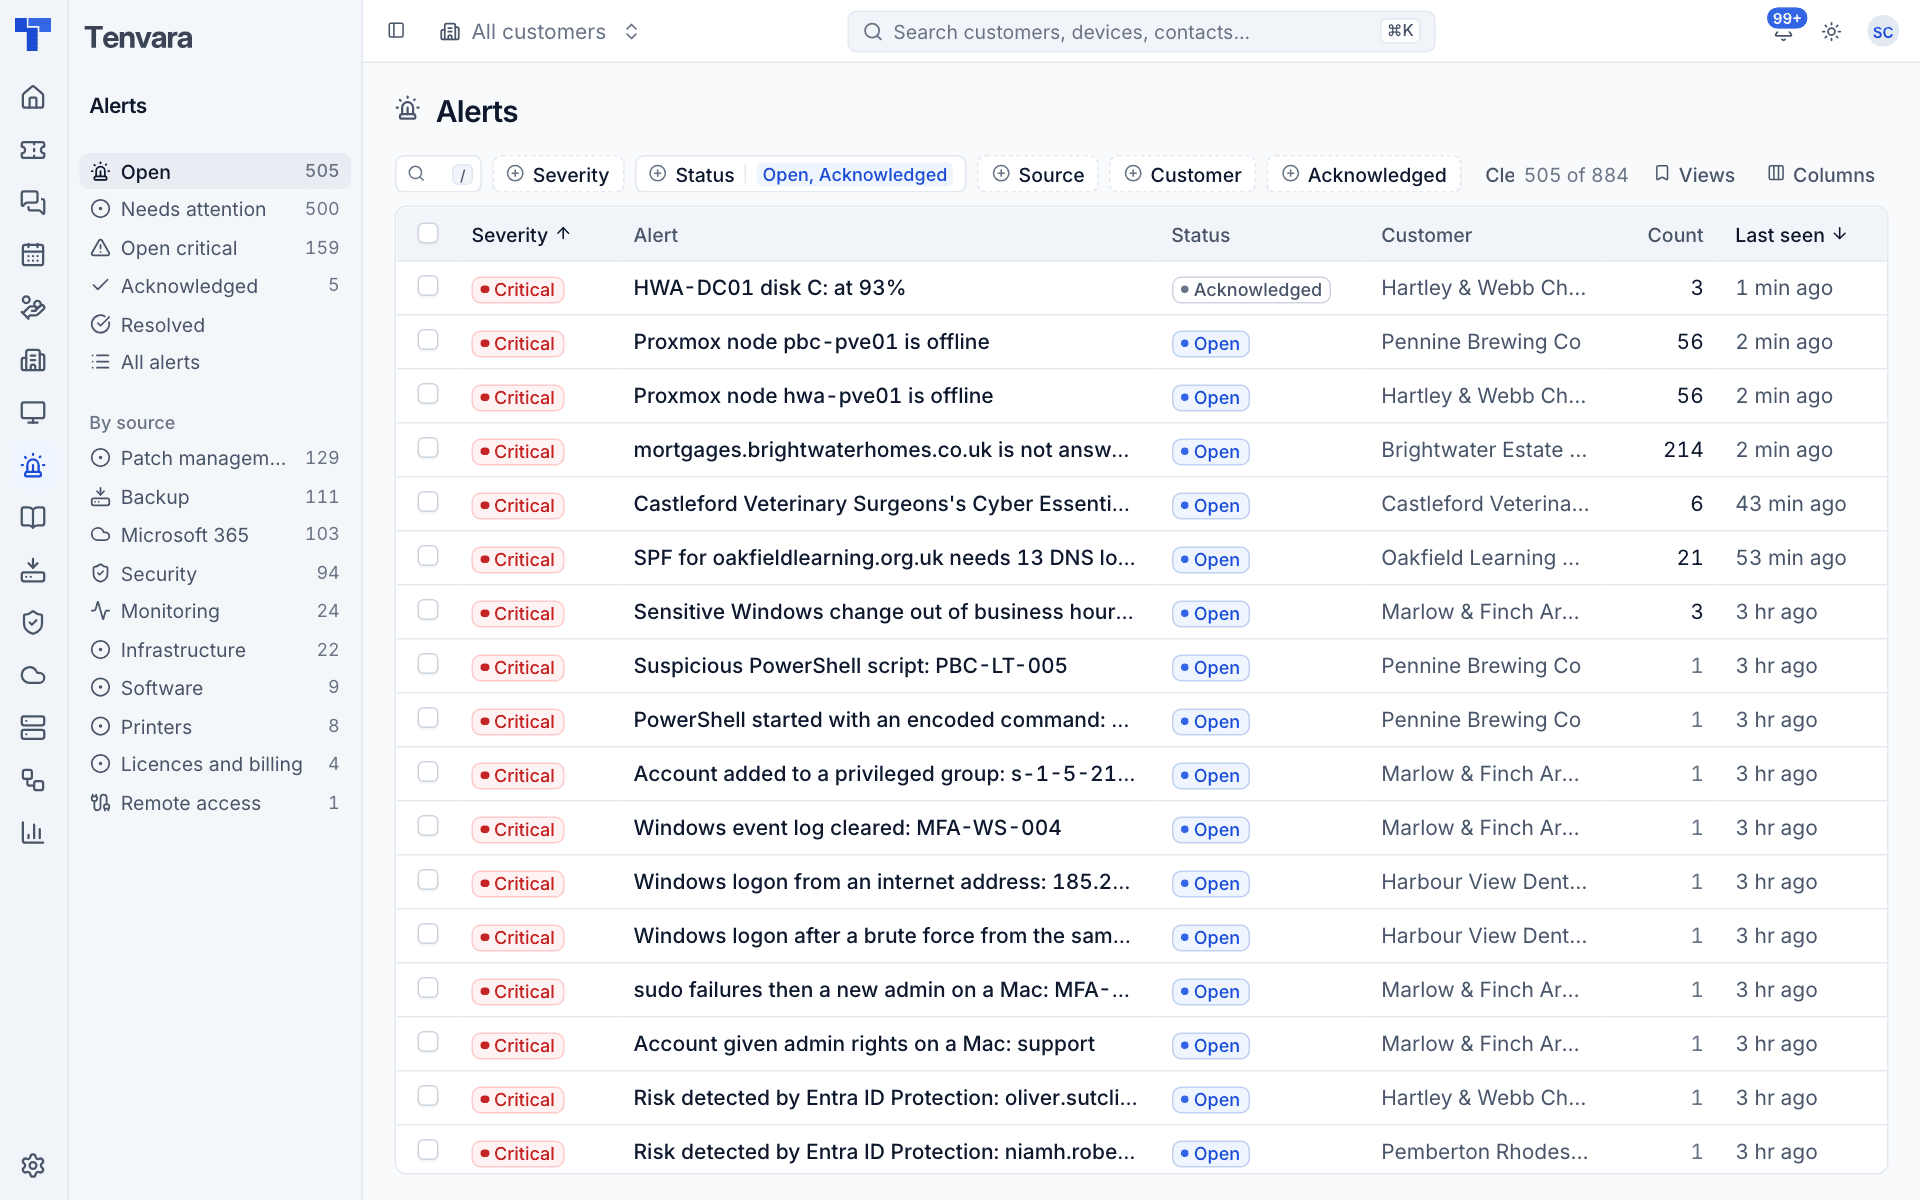
Alerts in the main navigation is one list for everything that needs attention across Tenvara: monitoring, patch management, backup, Microsoft 365, security, infrastructure, software, printers, licences and billing, and remote access.
One alert per problem
Each problem has one alert. When the same problem is seen again, Tenvara adds to the existing alert rather than opening another: Count goes up and Last seen moves on. When a monitoring rule gets worse (a disk going from warning to critical), the same alert changes severity and title.
Alerts move through three states:
| State | Meaning |
|---|---|
| Open | The problem is current and nobody has taken it. |
| Acknowledged | Someone has said they are on it. It stays in the open views until it is resolved. |
| Resolved | It cleared by itself (most monitoring alerts do when the problem goes away), or someone resolved it. |
Finding alerts
The sidebar has views and sources:
- Open, Needs attention, Open critical, Acknowledged, Resolved and All alerts.
- By source, with a count of what is open from each: Patch management, Backup, Microsoft 365, Security, Monitoring, Infrastructure, Software, Printers, Licences and billing and Remote access.
In the list, filter by Severity, Status, Source, Customer or Acknowledged, search with /, sort by any column and save your own views with Views. The customer switcher at the top narrows the list to one customer.
Reading an alert
Click an alert to open it in the side panel, or use the expand button to open it full page.
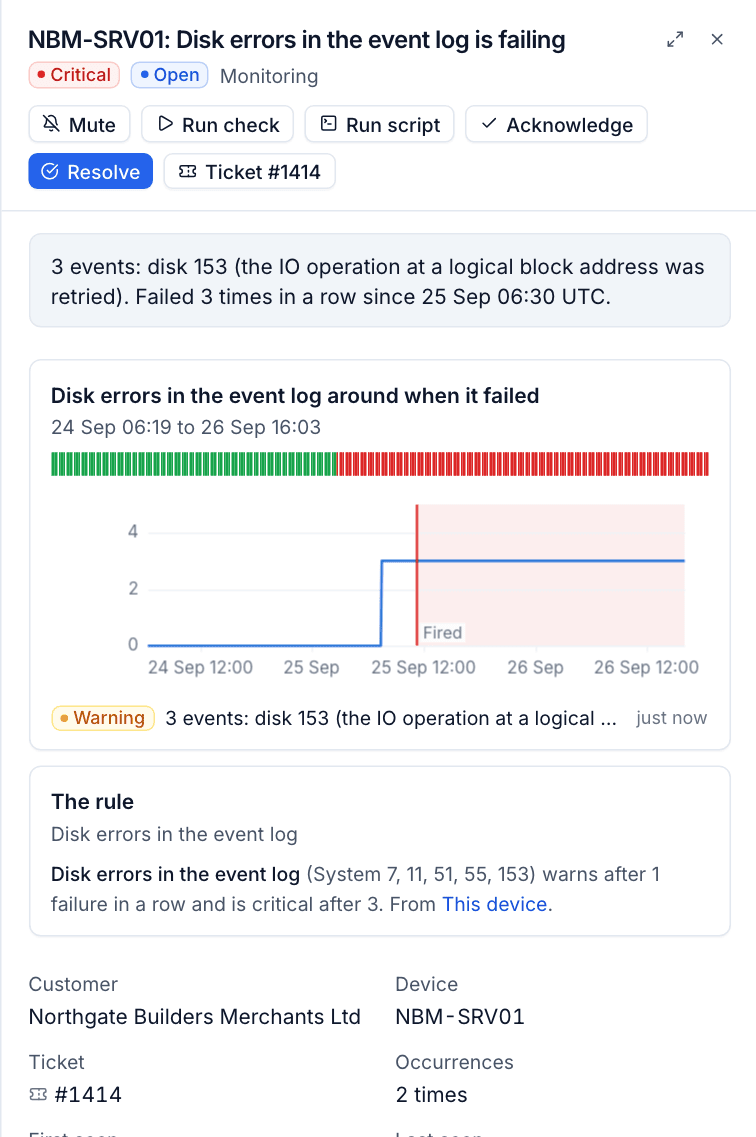
The panel shows:
- the severity, status and source, and a summary of what is wrong;
- for monitoring alerts, a chart of the metric or check around when it fired: from a few hours before to an hour after it cleared, with the time it was open shaded, Fired marked and the thresholds drawn. For an offline alert, the chart goes back to the last data so the gap shows;
- The rule: the check or threshold behind it, in words, and the policy it comes from (click through to edit it);
- the Customer, Device, Ticket, how many Occurrences, and when it was first and last seen;
- the alert's activity.
Monitoring alert titles say what is wrong, for example HWA-DC01 disk C: at 93%, NBM-SRV01: Disk errors in the event log is failing, TLG-FS01 is offline or HVD-SRV01 has needed a reboot for 8 days.
Acting on an alert
The buttons at the top of the panel:
| Button | What it does |
|---|---|
| Acknowledge | Marks the alert as taken, so the team knows someone is on it. |
| Resolve | Closes it by hand. |
| Ticket #... | Opens the ticket the alert raised, when an alert rule turned it into one. See Alerts into tickets and notifications. |
| Mute | Mutes this rule on this device for a while. See Maintenance windows and mutes. |
| Run check or Run checks | Runs the check (or all checks) on the device now, to confirm a fix. |
| Run script | Runs a script from the library on the alert's device. See Running and scheduling scripts. |
To act on several alerts at once, tick them in the list and use Acknowledge or Resolve in the bar that appears.
Note: An alert you resolve by hand while the problem carries on is not reopened. It opens again only after the problem has cleared and come back. Alerts cannot be reopened or un-acknowledged by hand.
Monitoring alerts that clear themselves
Monitoring alerts resolve on their own when the device's own data shows the problem has gone: a metric back past its clearing point for long enough, a check passing again, or an offline device heard from again. If a ticket was opened for the alert, the alert rule can resolve the ticket too.
Deleting or switching off the check or threshold behind an alert also resolves it, as does switching the Monitoring module off.
Was this page helpful?
Thanks for the feedback.