The device list
Find any device across your customers, filter it by status, health, agent and backup, and save the views you use every day.
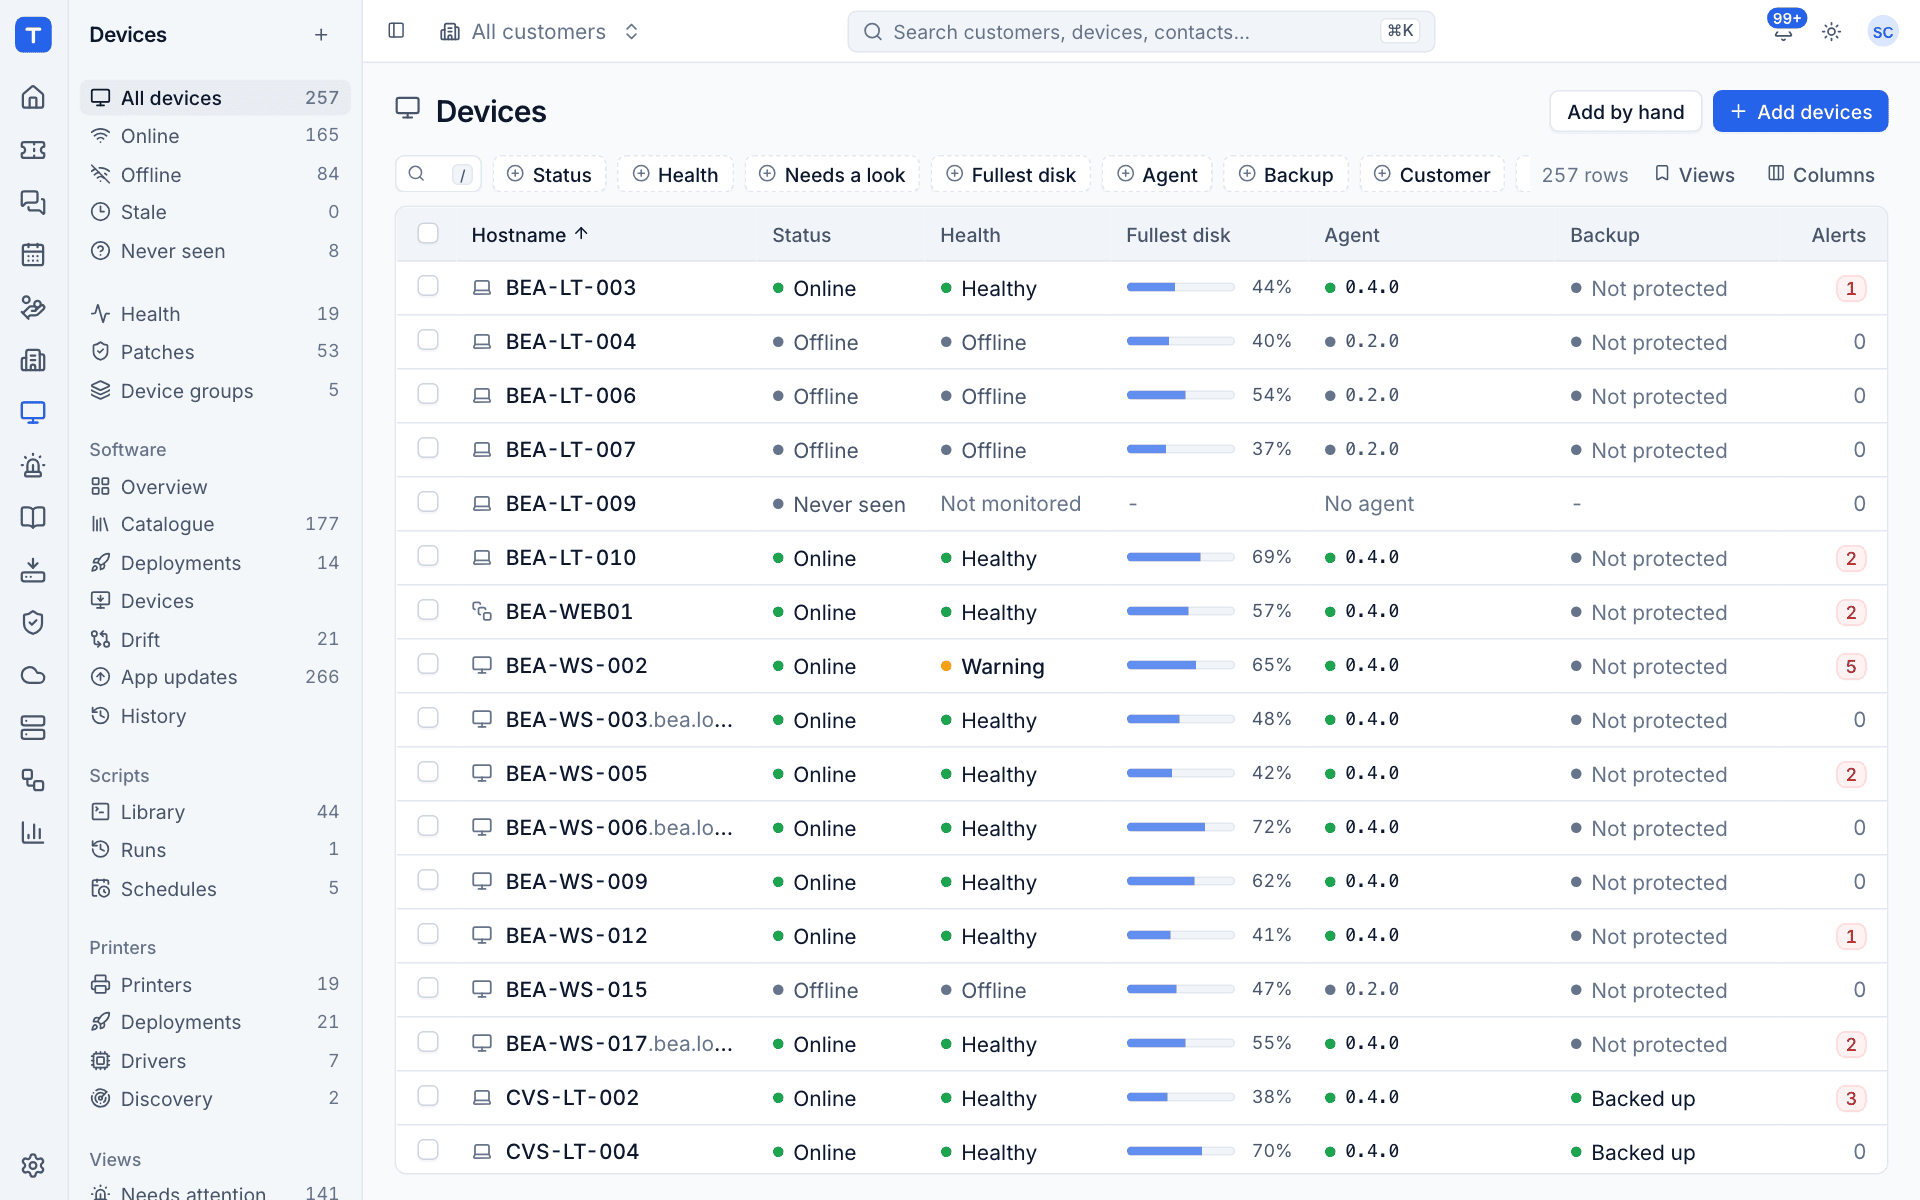
Devices in the main navigation holds every computer, server and virtual machine Tenvara knows about, for every customer. A device arrives when the agent enrols it, when you add it by hand, or when another source (backup, Microsoft 365, the security module) reports it. The same device is recognised by its serial number and hostname, so it is never listed twice.
What the sidebar holds
The Devices sidebar is where everything device related lives:
| Group | What is in it |
|---|---|
| All devices, Online, Offline, Stale, Never seen | The device list, filtered by connection status |
| Health, Patches, Device groups | Monitoring health for the fleet, patch compliance, and the groups policies apply to |
| Software | The catalogue, deployments, drift, app updates and history |
| Scripts | The library, runs and schedules |
| Printers | Printer deployment (see Printing) |
| Views | Saved filters such as Needs attention, Servers, Workstations, Needs a look, Not reporting, Disks nearly full, Backup failing, Not backed up, Has agent and Online agents |
| Remote access | Remote sessions, Enrolment and Installers |
The numbers beside each entry are live counts, so a glance at the sidebar tells you how many devices are offline, how many need a look and how many are behind on patches.
Statuses
| Status | Meaning |
|---|---|
| Online | The agent is connected now. |
| Offline | The agent has been seen before but is not connected. |
| Stale | The device has not been seen for a long while, so what Tenvara shows for it may be out of date. |
| Never seen | The device is known (added by hand or from another source) but no agent has ever connected. |
Health is separate from status. It comes from monitoring and reads Healthy, Warning, Critical, Offline or Not monitored. See Device health.
Filtering and finding devices
- Type in the search box (press
/to jump to it) to filter by hostname, customer or anything else shown. - Click a filter chip, for example Status, Health, Needs a look, Fullest disk, Agent, Backup, Customer, Type, OS or Open alerts, and tick the values you want.
- Click a column heading to sort by it.
- Use Columns to show or hide columns, and Views to save the current filters as a view of your own.
The customer switcher at the top of the screen narrows the whole list to one customer. Every column in the list can be sorted, and the Fullest disk bar makes nearly full disks easy to spot.
Tip: The views in the sidebar are ordinary saved filters. Needs a look shows the same devices as the Health page, and Disks nearly full lists volumes at 80% or more, or forecast to fill within 30 days.
Adding devices
There are two buttons at the top right of the list:
- Add devices creates an enrolment token and gives you the one-line install command for the agent. This is the normal way in. See Installing the agent.
- Add by hand creates a device record without an agent, for example a switch or a printer you want to document. It shows as Never seen until an agent or another source reports it.
Opening a device
Click a hostname to open the device page, with its health, patches, software, scripts, alerts, tickets and documentation in one place. See The device page.
Was this page helpful?
Thanks for the feedback.