Reports overview
What the Reports area covers, who can see which figures, and how to read the internal dashboard.
Reports pulls together figures from every part of Tenvara: tickets, time, contracts, licences, devices, patching, backup, security, Microsoft 365 and monitoring. It has three jobs:
- Tell you how the business is doing: recurring revenue, margin, utilisation, billable hours and SLA performance on one dashboard.
- Answer your own questions: the report builder turns any of that data into a filtered, grouped table or chart that you can save, share, export or have emailed on a schedule.
- Show customers what you did for them: a branded monthly PDF per customer, made on a schedule and emailed, published to the customer portal, or both.
The Reports sidebar
Open Reports from the rail. The sidebar has:
- Overview: the internal dashboard described below.
- Customer reports: every monthly customer report, with its templates. See Monthly customer reports.
- Report builder: templates and saved reports. See The report builder.
- Saved reports: your own saved reports and the ones colleagues shared, for one-click access.
- Service desk: the Time, Tickets, Satisfaction and Net Promoter Score reports from the service desk.
Who sees what
Reports has its own permission area, Reports. View lets someone open and run reports and download customer reports. Manage adds templates, saved reports, schedules and sending.
Money and people figures need a second permission area, Finance. Revenue, cost, margin, profitability, recurring revenue and staff utilisation are only shown to people with Finance view, and scheduling a report that contains them needs Finance manage. By default administrators manage Finance and technicians and read-only users have none.
A few more rules:
- Someone who can see tickets but not Reports still gets the Reports rail item, but only the Service desk reports.
- A module switched off in Settings is left out of every report, dataset and template. Nothing appears as an empty section in its place.
- Every figure is worked out in your business hours' time zone (Settings > PSA > Business hours), so "last month" means your calendar month.
Reading the overview
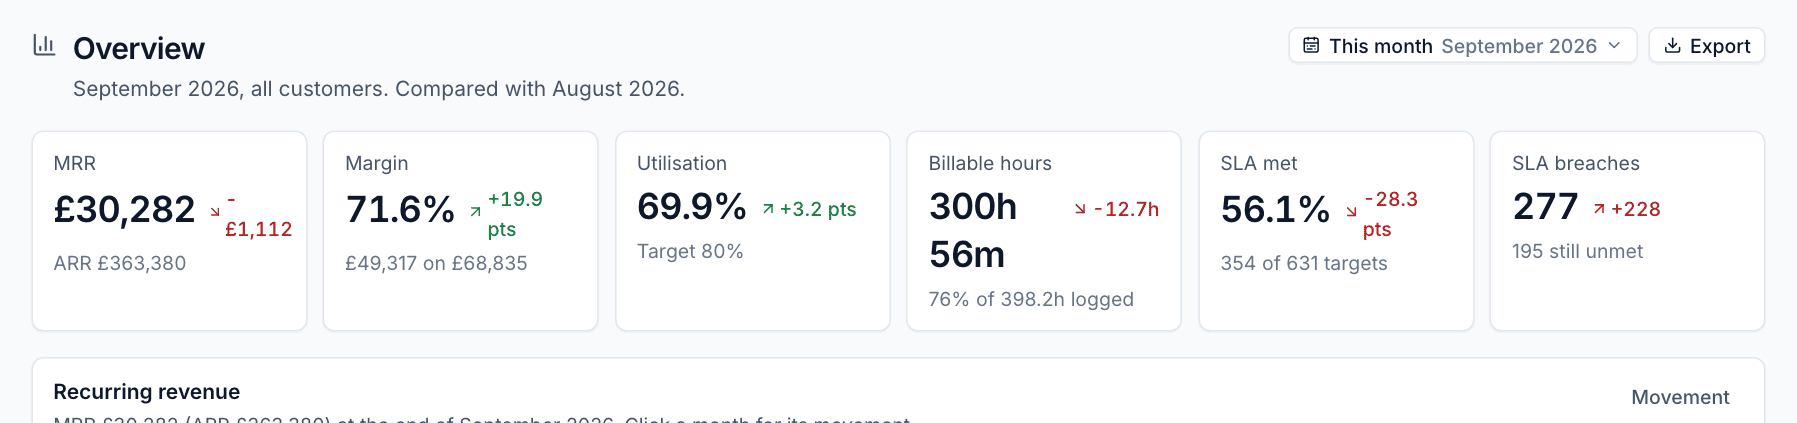
The overview covers one period, chosen with the period button at the top right: This month, Last month, Last 30 days, This quarter, Last quarter, This year or two dates of your own. Use the customer switcher in the top bar to narrow it to one customer.
Tiles
Each tile compares the period with the one of the same length before it, and clicking a tile opens the same figure in the report builder:
| Tile | What it shows |
|---|---|
| MRR | Monthly recurring revenue at the end of the period, its change, and ARR (MRR x 12) |
| Margin | Margin % for the period, the change in points, and margin on revenue in pounds |
| Utilisation | Logged time as a share of expected hours, against your target. Always across everyone, even with a customer chosen |
| Billable hours | Billable time logged, and its share of all time logged |
| SLA met | Response and resolution targets met out of those decided in the period |
| SLA breaches | Targets missed, and how many are still unmet |
MRR, margin and utilisation need Finance view. Billable hours and SLA need service desk view. Someone with neither sees a page pointing them to customer reports and the builder instead of empty tiles.
Recurring revenue
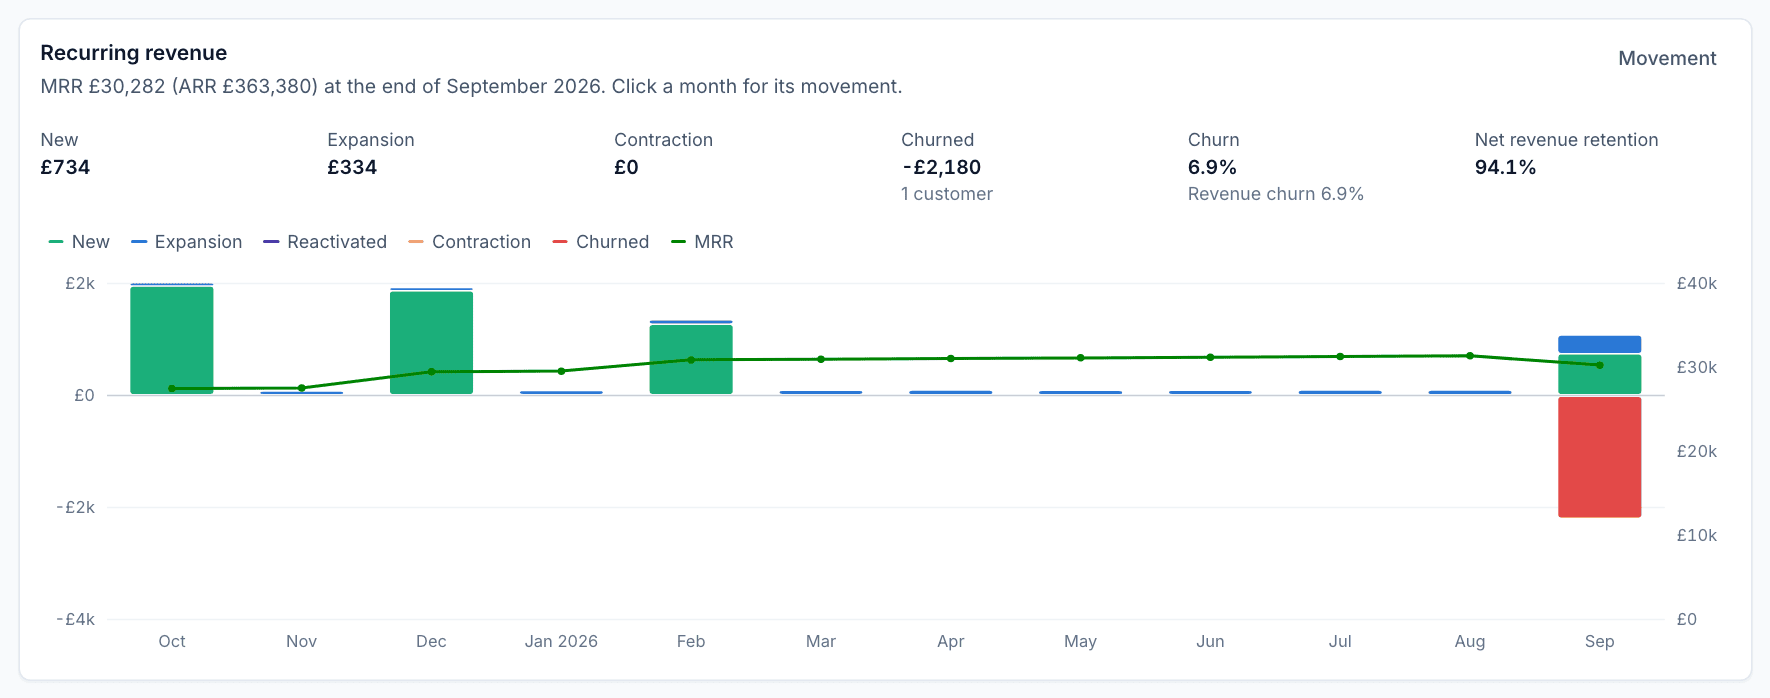
The line is MRR over the last twelve months (right-hand scale). The columns are each month's movement: New, Expansion and Reactivated above the line, Contraction and Churned below it. Above the chart are the period's totals, with:
- Churn: churned MRR over starting MRR. Revenue churn also counts contraction.
- Net revenue retention: starting MRR plus expansion, less contraction and churn, over starting MRR. New customers never flatter it.
Click a month to open its movement per customer in the builder.
Utilisation, hours and SLA
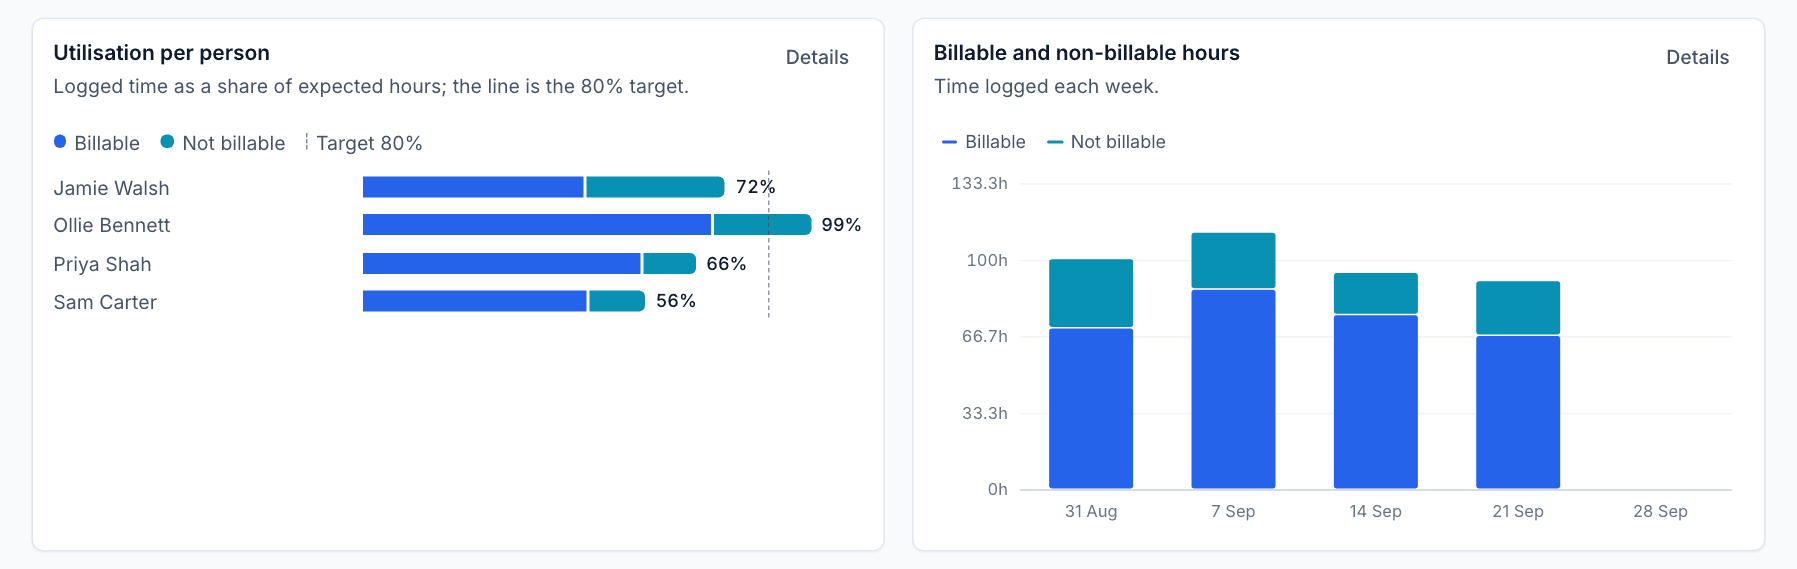
- Utilisation per person shows billable and non-billable time as a share of each person's expected hours, with your target as a dashed line. Expected hours come from each person's working pattern in Scheduling, less bank holidays, office closures and approved leave. In a period that is still running, only the days up to today count, so the figure means something mid-month.
- Billable and non-billable hours shows time logged each week.
- SLA breaches per week splits missed first response and resolution targets by week.
Profitability per customer
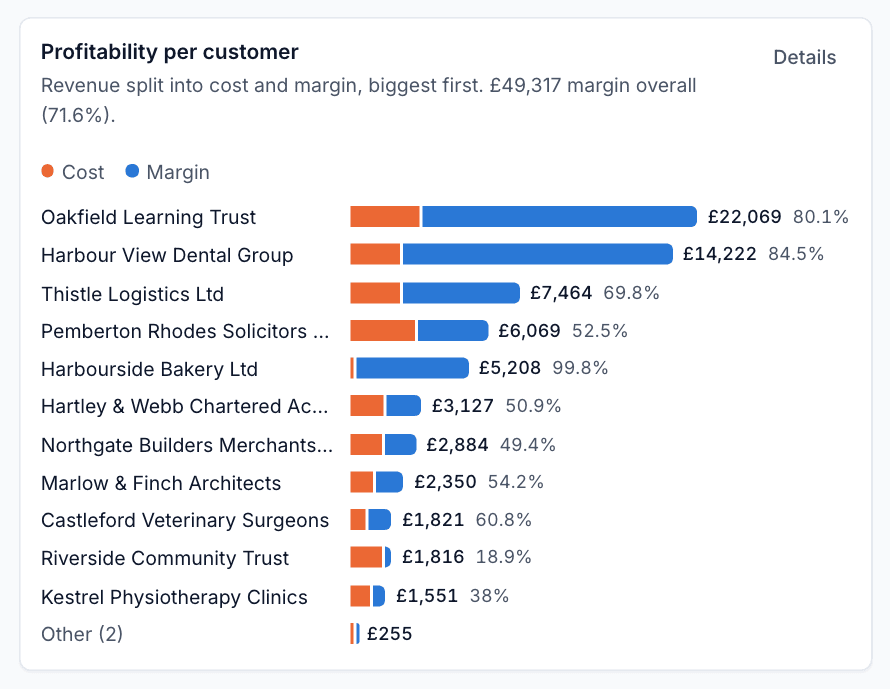
Each customer's revenue for the period, split into cost and margin, biggest first, with margin % beside it. Customers running at a loss show in red. How revenue and cost are worked out is on Rates, costs and targets.
Tables and export
Below the charts are sortable tables for profitability per customer, utilisation per person and the latest 50 SLA breaches. Details on a chart jumps to its table, and Export downloads a table as CSV.
Note: If anyone logged time without a cost rate, a warning lists them with a link to set one. Their time costs nothing until you do, which makes margins look better than they are.
Service desk reports
The Time, Tickets, Satisfaction and Net Promoter Score reports keep their own pages and filters. Each has a period switcher and filters such as customer, technician, queue or priority.
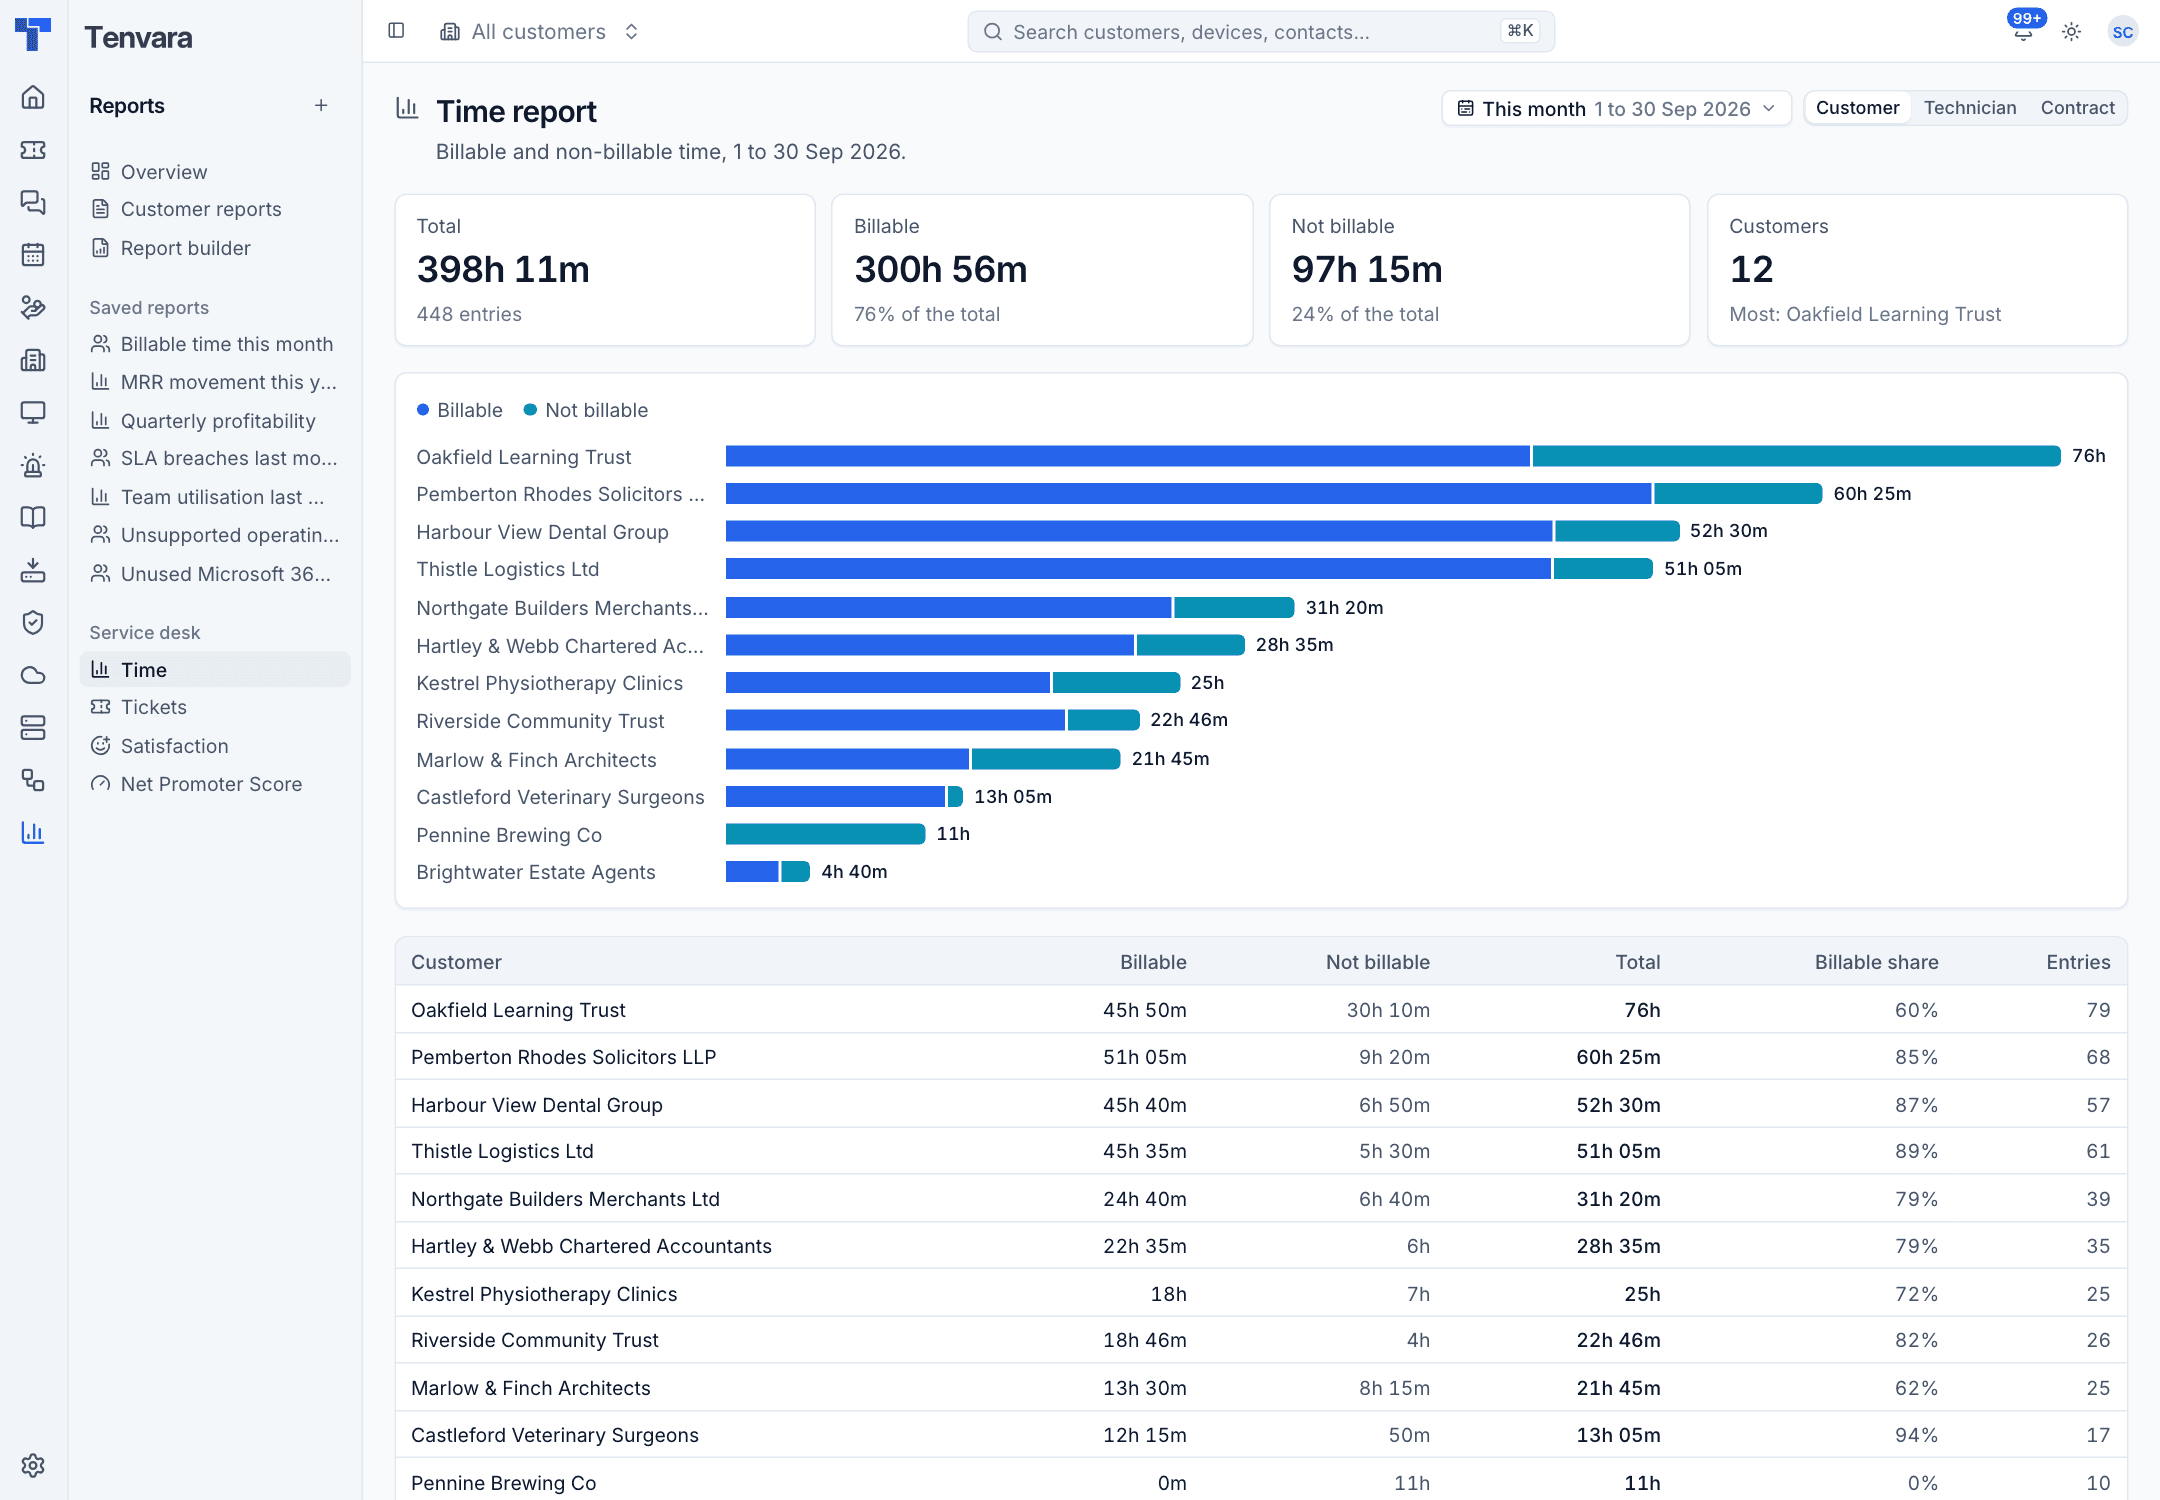
- Time: billable and non-billable time by customer, technician or contract.
- Tickets: tickets opened, resolved and still open, first response time and response and resolution SLA met, per customer.
- Satisfaction: ratings on resolved tickets and chats, per technician, with the comments.
- Net Promoter Score: every survey round, the score per customer (lowest first) and each answer.
Was this page helpful?
Thanks for the feedback.