Proxmox tasks, backups and alerts
Follow what Proxmox did and what was started from Tenvara, keep task logs Proxmox would lose, and understand every Proxmox alert.
Tasks
Infrastructure > Tasks lists what Proxmox did on every host (backups, updates, migrations, snapshots) and every action started from Tenvara, newest first. Each row shows the task, its status, the guest it concerned, the cluster and node, the customer, who started it and when.
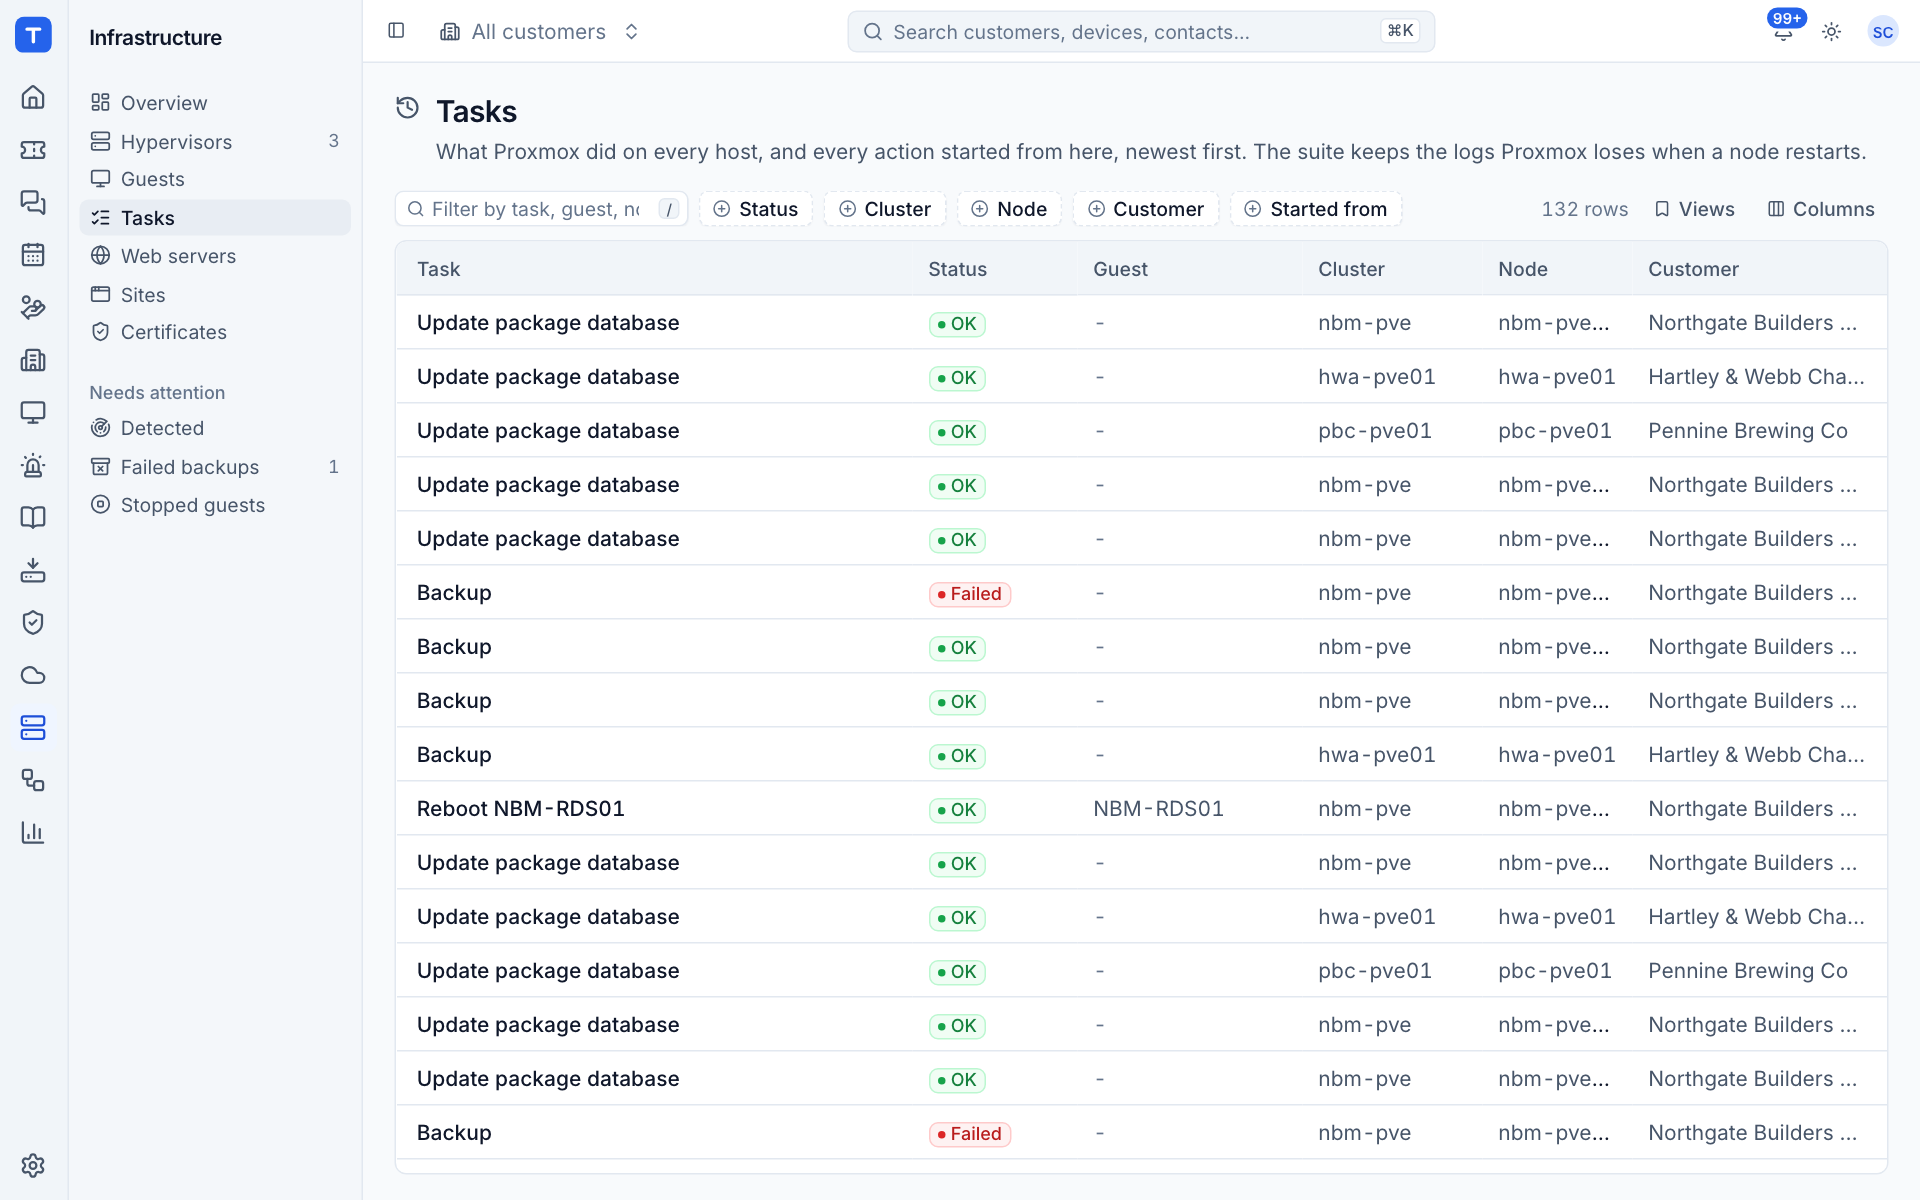
Filter by Status, Cluster, Node, Customer and Started from (Proxmox itself or Tenvara). Click a task to open it in the side panel with its log.
Tenvara keeps the logs of failed tasks from the last seven days and of every task it started. Proxmox forgets task logs when a node restarts; Tenvara does not. Tasks are kept for 90 days.
Actions you start from Tenvara appear in the list straight away as queued, then running, then OK or with the error Proxmox gave. The user shown is the Proxmox user that ran the task (the agent runs as root@pam); Tenvara records which technician asked on its own action record.
Backups
Tenvara reads the results of vzdump backups from each node's task logs, one row per guest per backup run, including the archive name, size and storage, or the error. You see them:
- on each guest's page under Backups
- on the cluster page under Backup jobs (the jobs scheduled in Proxmox, their schedule, target and next run)
- on the overview under Backups that need a look
- in the Failed backups view in the sidebar
A guest's backup is overdue when it is in an enabled backup job and has had no successful backup within the job's interval plus 12 hours (a day for a daily job, a week for a weekly one).
Tip: Tenvara reports on Proxmox's own backups. To back up guests with Tenvara Backup instead, see Backup.
Alerts
Proxmox alerts appear in Alerts with the source Infrastructure, and can open tickets through your alert rules like any other alert. They are only raised for adopted clusters.
| Alert | Severity | Raised when | Clears when |
|---|---|---|---|
| Node offline | Critical for a standalone node, otherwise warning | The cluster says the node is offline, or its agent has not reported for 15 minutes and no other node shows it online | The node is online again |
| Quorum lost | Critical | The cluster is not quorate | Quorum returns |
| Storage filling up | Warning over 85%, critical over 95% | An active storage pool is that full | It drops under 85% |
| Guest stopped | Warning | A guest marked Should be running is not running in two reports in a row | It runs, or the mark is removed |
| Backup failed | Warning | The guest's last backup failed | A later backup succeeds |
| Backup overdue | Warning | A guest in an enabled job has no successful backup within its expected interval | A successful backup |
| Action failed | Warning | An action started from Tenvara failed | The same action succeeds |
What the agent reports and how often
Each node's agent sends a report on connect, every five minutes once the cluster is adopted, and after every action. A report covers:
- the cluster (name, quorum, members) and every node, guest and storage pool
- each guest's configuration (operating system type, cores, memory, disks, networks, start at boot, guest agent), addresses from the guest agent and snapshots
- backup jobs and the recent tasks, with logs of failed tasks
- per-minute CPU, memory, network and disk figures, which Tenvara rolls into hourly averages for the charts
If a part of the report fails (for example Proxmox took too long to answer), Tenvara keeps what it already had for that part rather than blanking it.
Was this page helpful?
Thanks for the feedback.