Customer health score
One number out of 100 per customer, what goes into it, where it shows and how to tune it.
The health score sums up how well looked after a customer is in one number out of 100: backups, patching, security, SLA, satisfaction, overdue tickets and your margin. It is kept every day, so you can see whether a customer is getting better or worse, and the parts dragging it down each link to where you fix them.
Where it shows
- The customer's overview: a Health score block near the top with the score, grade, the change over 30 days, a 90-day sparkline and the parts losing the most points. Show all parts lists every part.
- Home: for people who can see Reports, a list of customers whose health is poor or falling.
- Monthly customer reports: on the cover and in the summary.
- Reports > Customer reports: the score when each report was made.
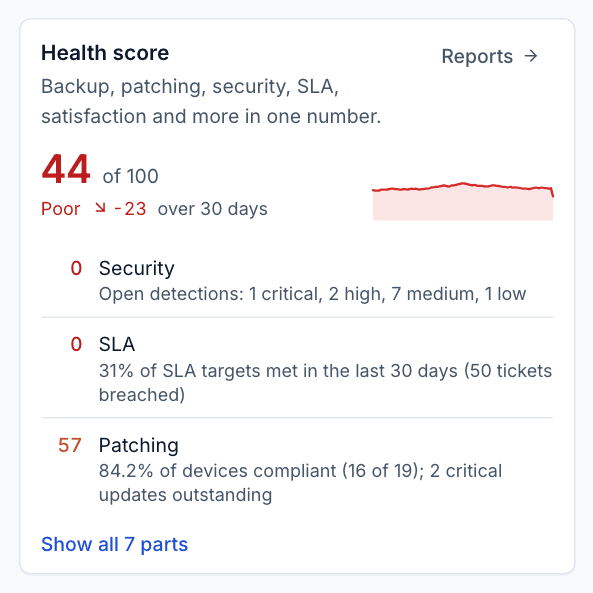
Each part shows its own score out of 100 and the reason, for example "Open detections: 1 critical, 2 high, 7 medium, 1 low" or "84.2% of devices compliant (16 of 19); 2 critical updates outstanding". Click through to the page where it is fixed.
Grades
| Grade | Score |
|---|---|
| Good | 75 or more |
| Fair | 50 to 74 |
| Poor | Below 50 |
A customer counts as falling when the score has dropped 10 points or more over 30 days. A new customer with nothing to measure has no score rather than a good one.
What goes into it
Each part is scored from 0 to 100 and counts its share (weight) of the total:
| Part | How it is scored | Default weight |
|---|---|---|
| Backup | Share of backup runs that succeeded over the look-back window, endpoints and Microsoft 365 together (a run with warnings counts half), less 10 points per protected device or tenant without a recent good backup. Full marks at 98%, none at 80% | 20% |
| Patching | Patch compliance today. Full marks at 95%, none at 70% | 20% |
| Security | 100 less points per open detection: 40 critical, 20 high, 8 medium, 2 low | 20% |
| SLA | Response and resolution targets met over the window. Full marks at 95%, none at 70% | 15% |
| Satisfaction | Share of good ratings over 90 days, with at least 3 ratings. Full marks at 95%, none at 60% | 10% |
| Overdue tickets | 100 less 20 points per open ticket past its resolution target | 5% |
| Margin | Margin % over 90 days from profitability. Full marks at 40%, none at 10% | 10% |
A part whose module is off, or that has nothing to measure for a customer, is left out and the others share its weight.
Note: Margin is your business, not the customer's. It counts towards the score your staff see, but a customer's own report works its score out without it and never shows it. Staff without Finance view see the margin part's score but not the figure behind it.
Changing the score
Go to Settings > Reports > Health score (administrators).
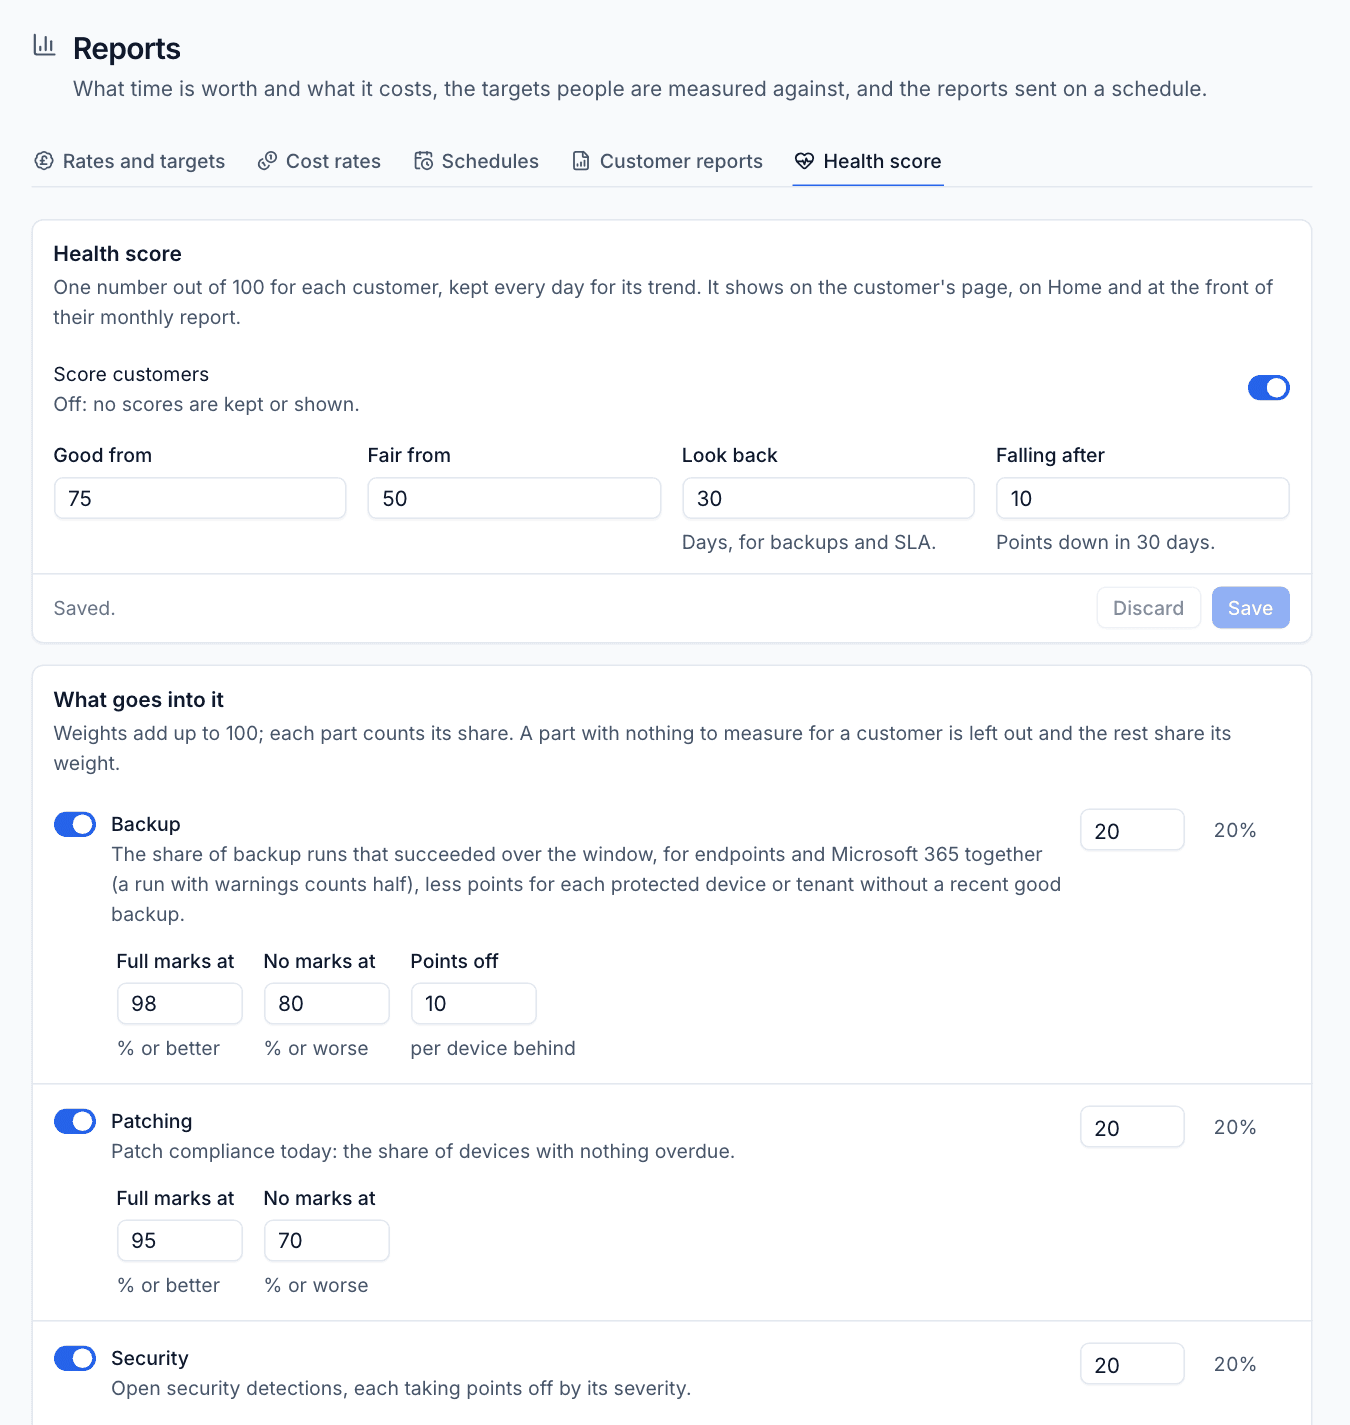
- Score customers: switch off to stop keeping and showing scores.
- Good from and Fair from: the grade boundaries.
- Look back: days used for backups and SLA (30 by default).
- Falling after: points down in 30 days before a customer counts as falling.
- Click Save.
Under What goes into it, switch parts on or off, set each weight (the percentages beside them show each part's real share), and set its marks: Full marks at, No marks at, Points off per device behind, points per open detection by severity, and the window and minimum ratings for satisfaction. Full marks must need a better figure than no marks.
Scores are kept once a day, so a change shows in each customer's score straight away and in the trend from the next day.
Was this page helpful?
Thanks for the feedback.