Device health
Read the fleet Health page, a device's health, charts, checks and services, and find out why a device is monitored the way it is.
The Health page
Devices > Health is the whole fleet at a glance. The number beside Health in the sidebar is how many devices need a look.

- Counts by health: Critical, Warning, Offline, Healthy and Not monitored. Click one to open the device list filtered to it.
- Needs a look: critical and warning devices, and offline ones whose policy alerts on it, critical first. Each row shows CPU, memory, the fullest disk and what is wrong.
- Failing checks: services, websites, ports and event logs that are not passing, and for how long. Click one to open that check on its device.
- Disks nearly full: volumes at 80% or more, or forecast to fill within 30 days, with the forecast (for example Full in about 9 days, or Not filling).
- Monitoring alerts: the open alerts, critical first.
The page follows the customer switcher at the top of the screen, and the picker at the top right narrows it to one device group.
Tip: Disk forecasts are a straight line through the last 14 days of hourly averages. Only rising trends get a date, and a weak trend says so.
A device's health
On a device page, Health comes first.
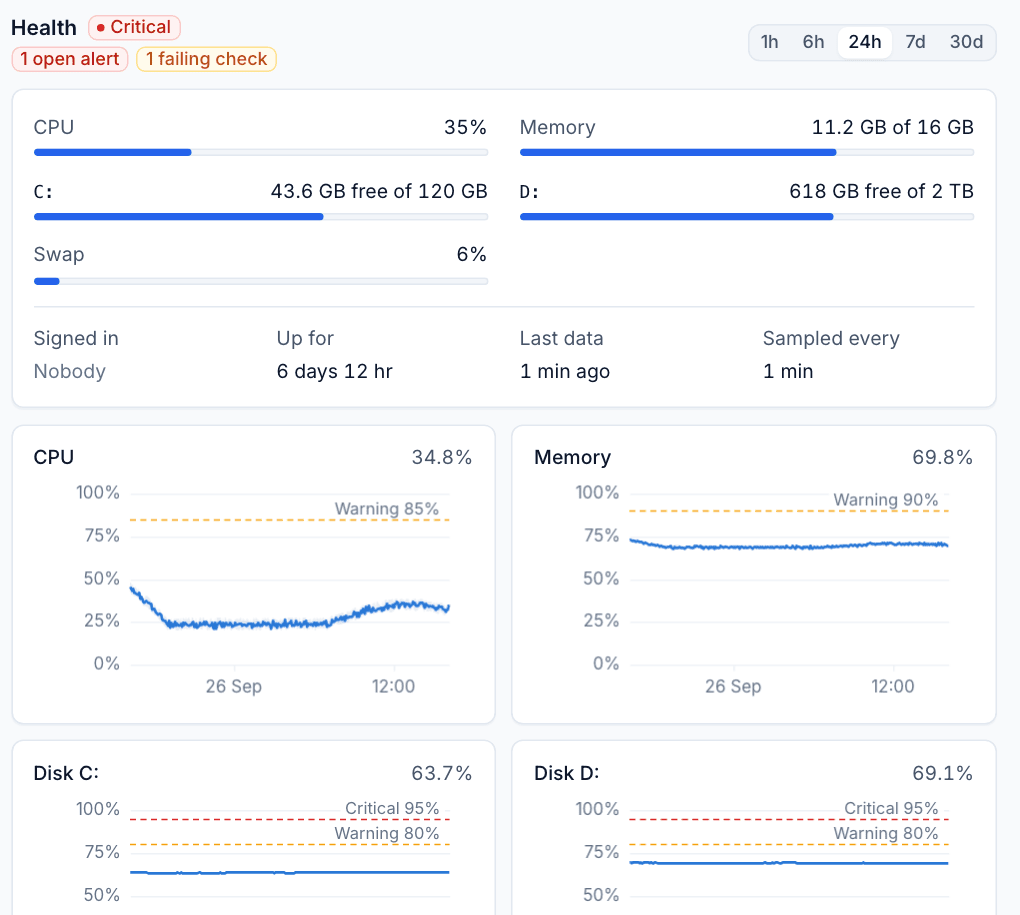
- The badge shows the device's health, with chips for open alerts, failing checks, maintenance and mutes.
- CPU, memory, swap and each disk, with space free and how soon it fills when it is filling.
- Who is signed in, how long it has been up, when data last arrived and how often it is sampled. When the device is offline the numbers are dimmed and say how old they are.
- Charts for CPU, memory, each disk, the network (in and out) and, where reported, load and temperature. The device's own thresholds are drawn on them as dashed lines.
Using the charts
- Pick a range: 1h, 6h, 24h, 7d or 30d.
- Drag across any chart to zoom in on that stretch. The range shows as a chip you can clear.
- Hover to see the exact time and value; the crosshair is shared across every chart on the page.
- Click a legend entry to hide or show a line (
OptionorAltclick shows it alone). - The range goes into the page address, so you can send a colleague the exact view.
Gaps in a chart are real gaps in the data, such as a laptop switched off overnight.
Checks
The Checks section lists every check that runs on the device, with its status, what it checks, the last result and the last 24 hours.
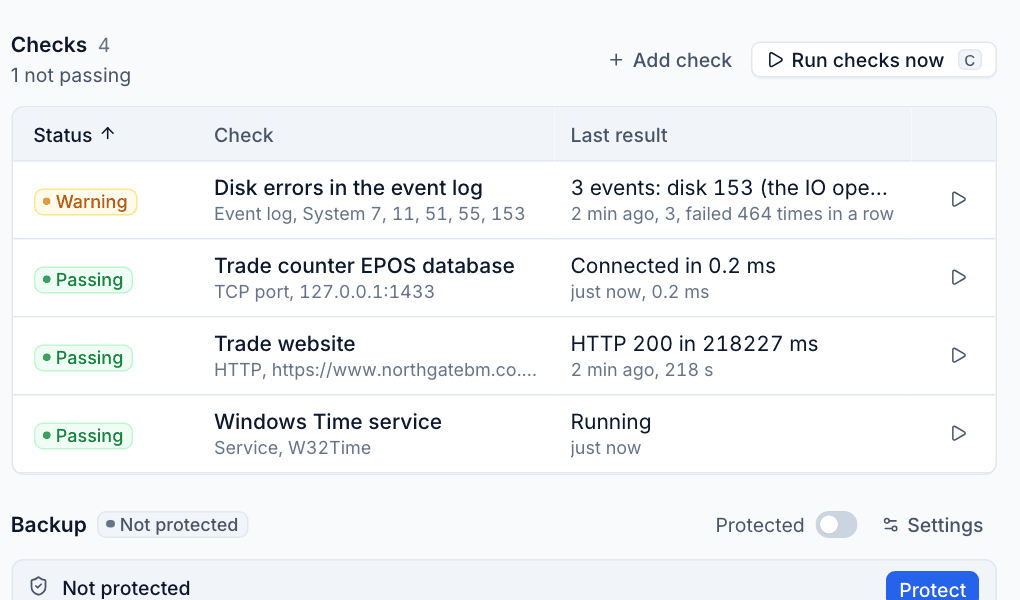
- Run checks now (or press
C) runs every check at once; the play button on a row runs one. - Add check adds a check for this device only, in its own override policy.
- Click a check to open its history.
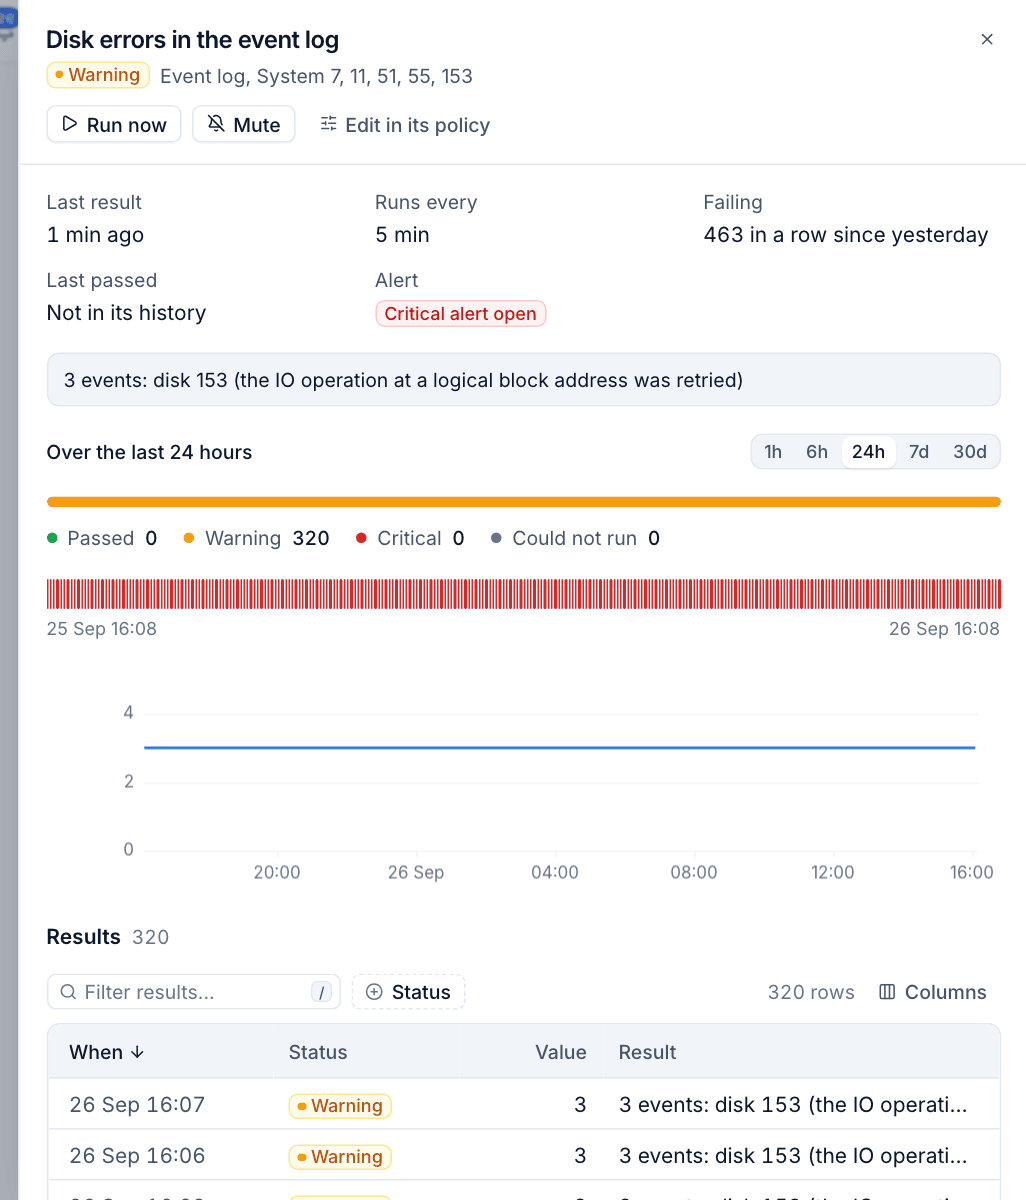
The history shows when it last ran and passed, how many times it has failed in a row, whether an alert is open, the pass and fail strip and value chart for the chosen range, and every result. Run now, Mute and Edit in its policy are at the top.
Services
The Services section lists every service the agent reports, those set to start automatically but not running first. Filter by All, Not running, Running or Stopped, by state and start type, or by name.
The Monitoring card
The Monitoring card in the side column lists the policies that reach the device (most specific last), its device groups, its maintenance windows and its mutes.
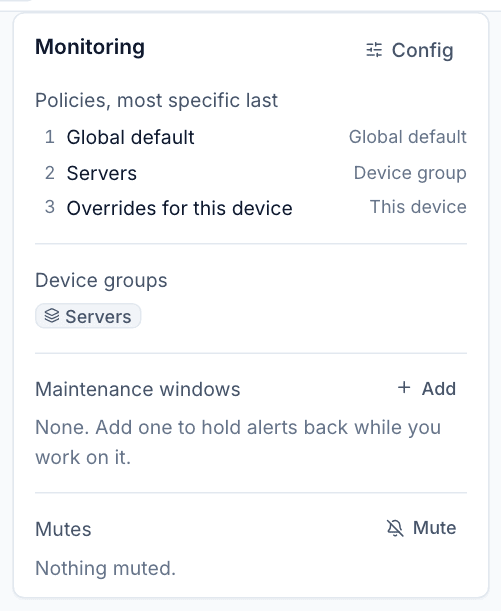
Click Config to see exactly how the device is monitored.
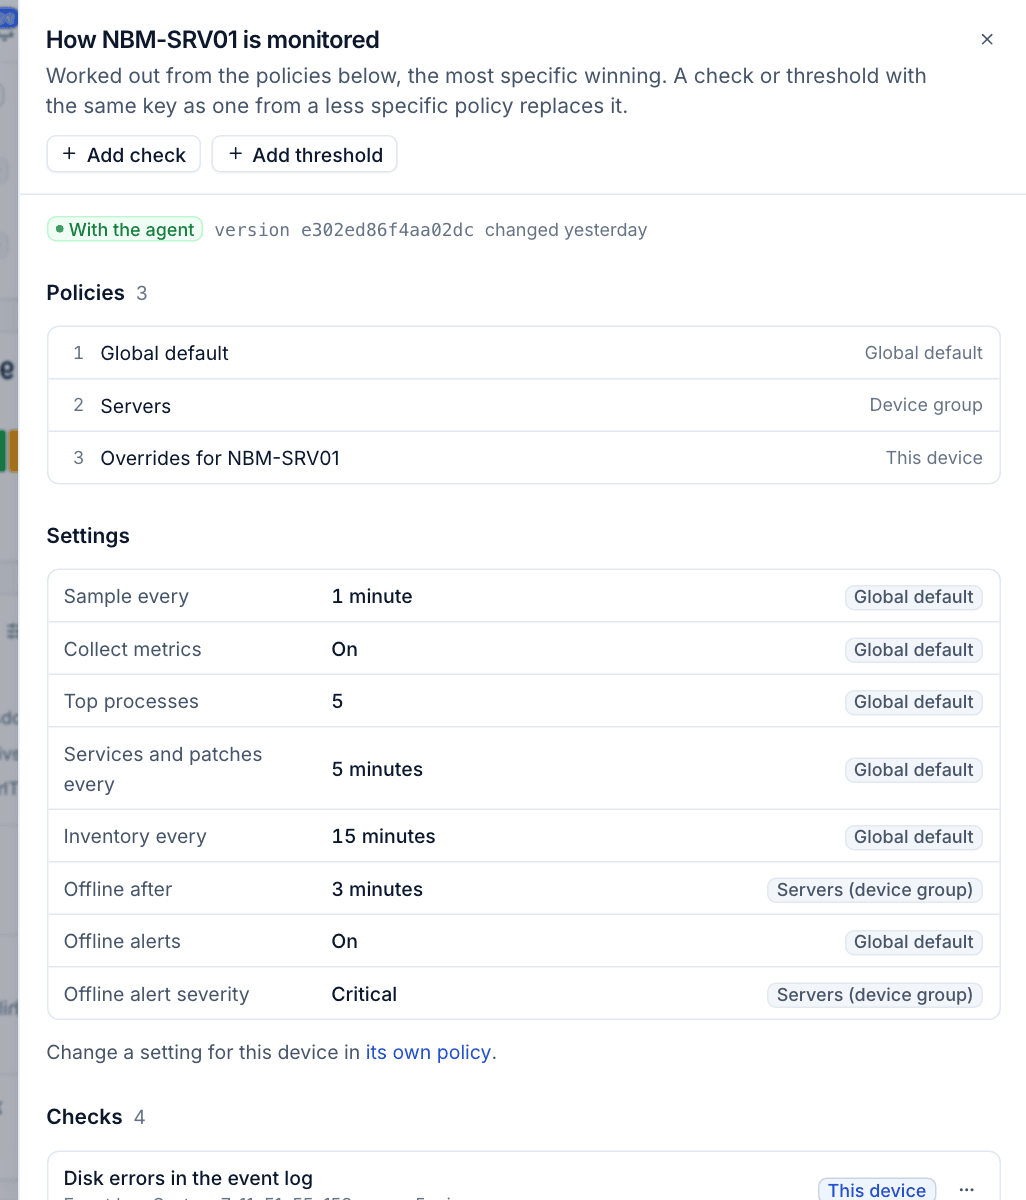
- With the agent confirms the agent has the current configuration.
- Policies lists them in order.
- Settings, Checks and Thresholds show each value and the policy it comes from.
From here you can change an inherited check or threshold for this device only (Tenvara makes a copy with the same key in the device's own policy), switch one off, go back to the inherited one, or add new ones with Add check and Add threshold.
The side column also shows Availability: the share of the last 30 days the device was reporting, with a strip by day.
Was this page helpful?
Thanks for the feedback.