The device page
Everything about one device on one page, what each section shows, the actions in the header and how to switch agent modules on or off for one device.
Open any device from the device list, a ticket, an alert or search (Cmd+K) to reach its page. It brings together what the agent reports, what monitoring sees, patches, software, scripts, alerts, tickets and documentation for that one machine.
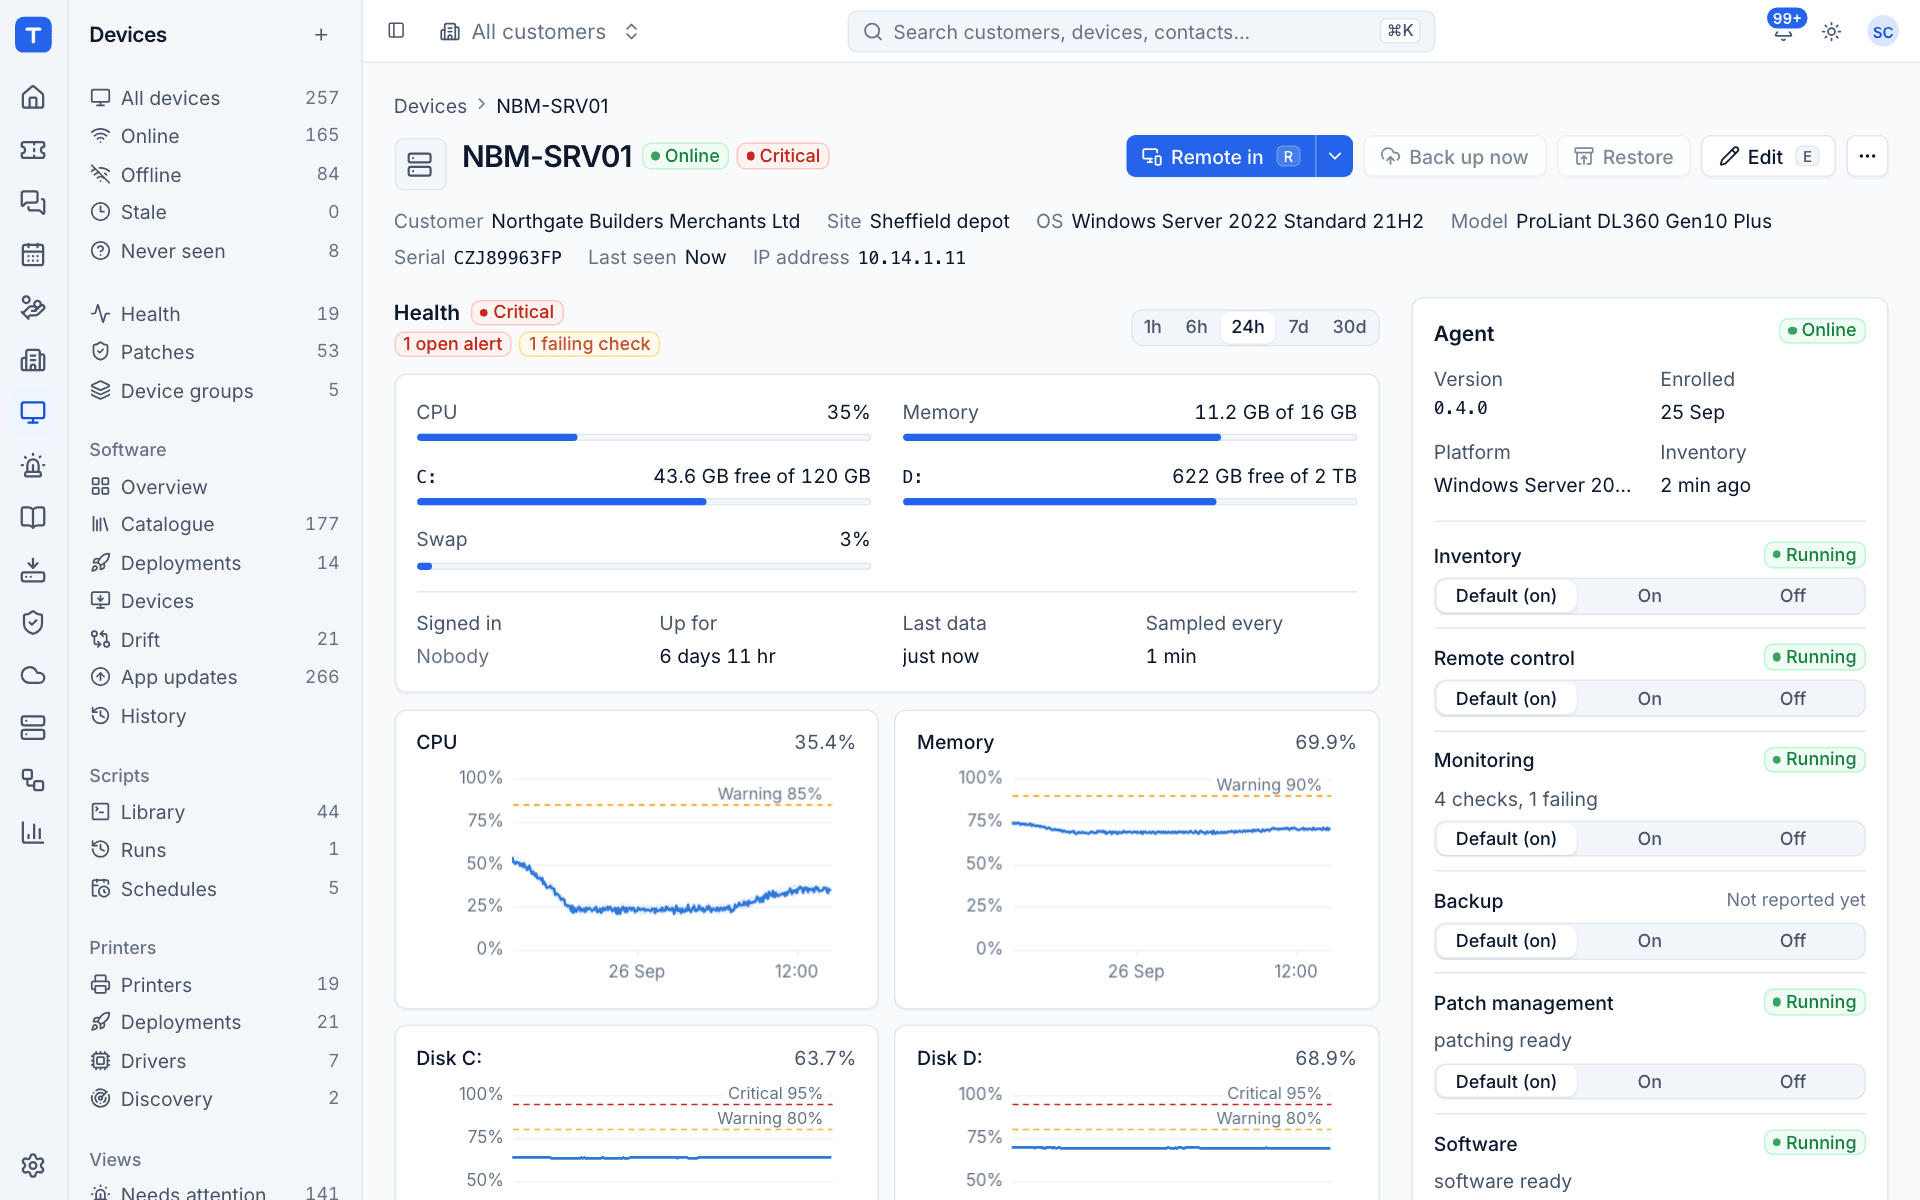
The header
Under the hostname you see the online status and health, then the customer, site, operating system, model, serial number, when it was last seen and its IP address.
The buttons along the top:
| Button | What it does |
|---|---|
Remote in (R) |
Starts a remote control session. The arrow beside it offers View only and Open in a new window. See Remote control. |
| Back up now and Restore | Backup actions, when the device is protected. See Backup. |
Edit (E) |
Change the customer, site, hostname, type, operating system, version, manufacturer, model, serial, IP and MAC address, and notes. |
| ... | Everything else (below). |
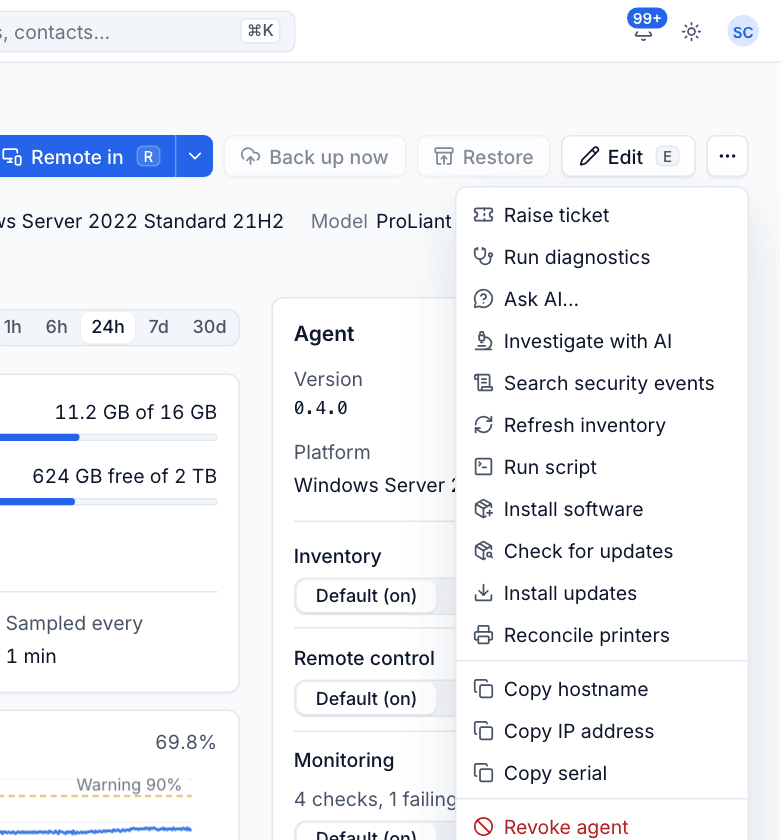
The ... menu holds:
- Raise ticket for this device and customer.
- Run diagnostics, see Diagnostics.
- Ask AI... and Investigate with AI, see AI.
- Search security events for this device.
- Refresh inventory to ask the agent for fresh hardware and software details now.
- Run script, Install software, Check for updates, Install updates and Reconcile printers.
- Copy hostname, Copy IP address and Copy serial.
- Revoke agent, which disconnects the agent and stops it signing in again.
The main column
From top to bottom:
- Health: CPU, memory, swap and every disk, who is signed in, uptime, when data last came in and how often it is sampled, followed by charts for CPU, memory, each disk and the network. See Device health.
- Diagnostics: the latest diagnostics run and what stood out.
- Patches: compliance, missing updates, the next maintenance window and recent installs. See Patching.
- Software: deployments that apply to the device, what is installed, updates available and history. See Software deployment.
- Scripts: recent script runs on this device, with Run script and All runs.
- Printers: printers deployed to the device and whether they are in sync.
- Security: security events, detections and the protection report (antivirus, EDR, firewall, encryption, local admins).
- Open alerts, Checks, Backup, Tickets and Documentation (credentials, records and articles linked to the device).
- Services: every service with its state and start type, filterable to those not running.
- Hardware and OS: processor, memory, BIOS, build, domain, time zone, network interfaces and disks.
- Activity: a timeline of what happened, from the agent going offline to remote sessions and alerts.
The side column
- Agent: the version, when it enrolled, the platform and when inventory last came in, then every module with its state.
- Remote sessions: the latest sessions on this device.
- Availability: the share of the last 30 days the device was reporting, with a strip by day.
- Monitoring: the policies that reach the device, its groups, maintenance windows and mutes.
- Top processes: the busiest processes by CPU and memory.
- Where it is: the customer, site address and the people at that site.
Switching agent modules for one device
Each module in the Agent card has three choices:
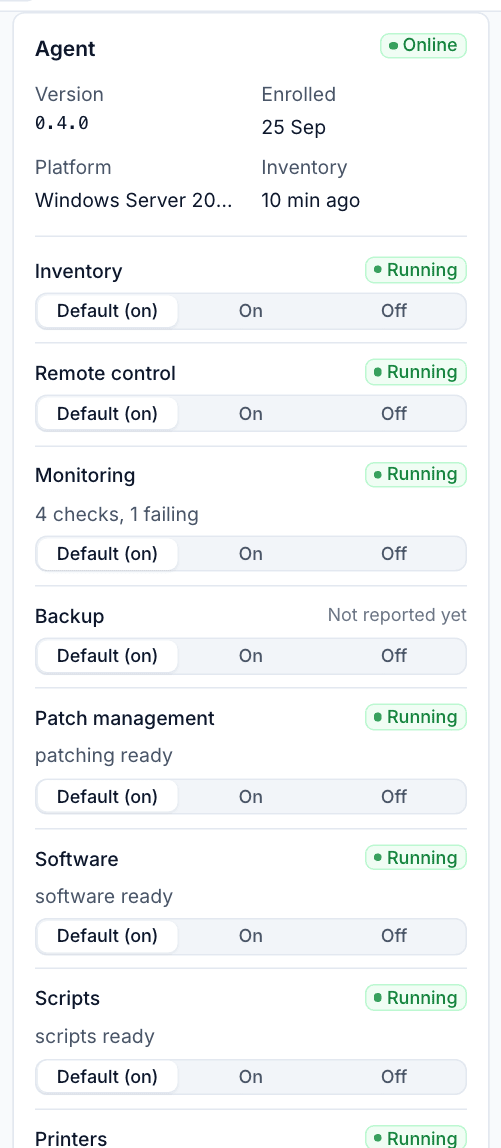
- Default follows the workspace setting in Settings > Devices and agent (shown in brackets, for example Default (on)).
- On runs the module on this device whatever the default says.
- Off stops it on this device.
The state badge beside each module shows what the agent says: Running, a short status such as 4 checks, 1 failing, or Not reported yet.
Note: Switching Monitoring off for a device stops its metrics and checks, and resolves its open monitoring alerts. Switching Remote control off stops anyone remoting in to it.
Was this page helpful?
Thanks for the feedback.