Proxmox clusters and nodes
How Proxmox VE hosts are detected, adopting a cluster for a customer, and reading the cluster and node pages.
Tenvara manages Proxmox VE through the agent on each node. The agent talks to the node's own local API as root, so there is no API user, token or secret to create on Proxmox, nothing listens on the network, and there is no self-signed certificate to trust. Because every node runs an agent, the cluster stays visible when any one node is down.
Before you start
- Install the Tenvara agent on every node of the cluster, the same way as any Linux server. See Installing the agent.
- Check the Hypervisor role is on for those devices in Settings > Devices and agent. It is on by default.
Within a few minutes of the agent connecting, the node reports the cluster (or itself, if it is a standalone node), every guest, storage, backup jobs and recent tasks. The agent reports on connect and then every five minutes (every 15 minutes before adoption), and again after every action.
Adopting a cluster
A newly reported cluster appears as Detected. You can look at everything it reported, but Tenvara will not queue any action on it or raise alerts for it until it is adopted. Adoption is for the whole cluster, not node by node.
- Open Infrastructure > Hypervisors, or the Detected view in the sidebar.
- Open the detected cluster or standalone node.
- Press Adopt.
- Confirm the Customer. It defaults to the customer whose devices reported it; change it only if the hardware belongs to someone else.
- Confirm. Adopting tells every node's agent it may now accept actions.
You need the Manage permission for Infrastructure to adopt. From the hypervisor list you can also press a on a detected row to adopt it.
Note: A guest page on a detected host says so: its figures are shown as reported, and power actions, snapshots and backups start once the host is adopted for its customer.
The hypervisor list
Infrastructure > Hypervisors lists every cluster and standalone node with its Health, Customer, Nodes online, Guests up, CPU, Memory and Fullest storage. Filter by health, adoption state and customer, save views and choose columns like any other list.
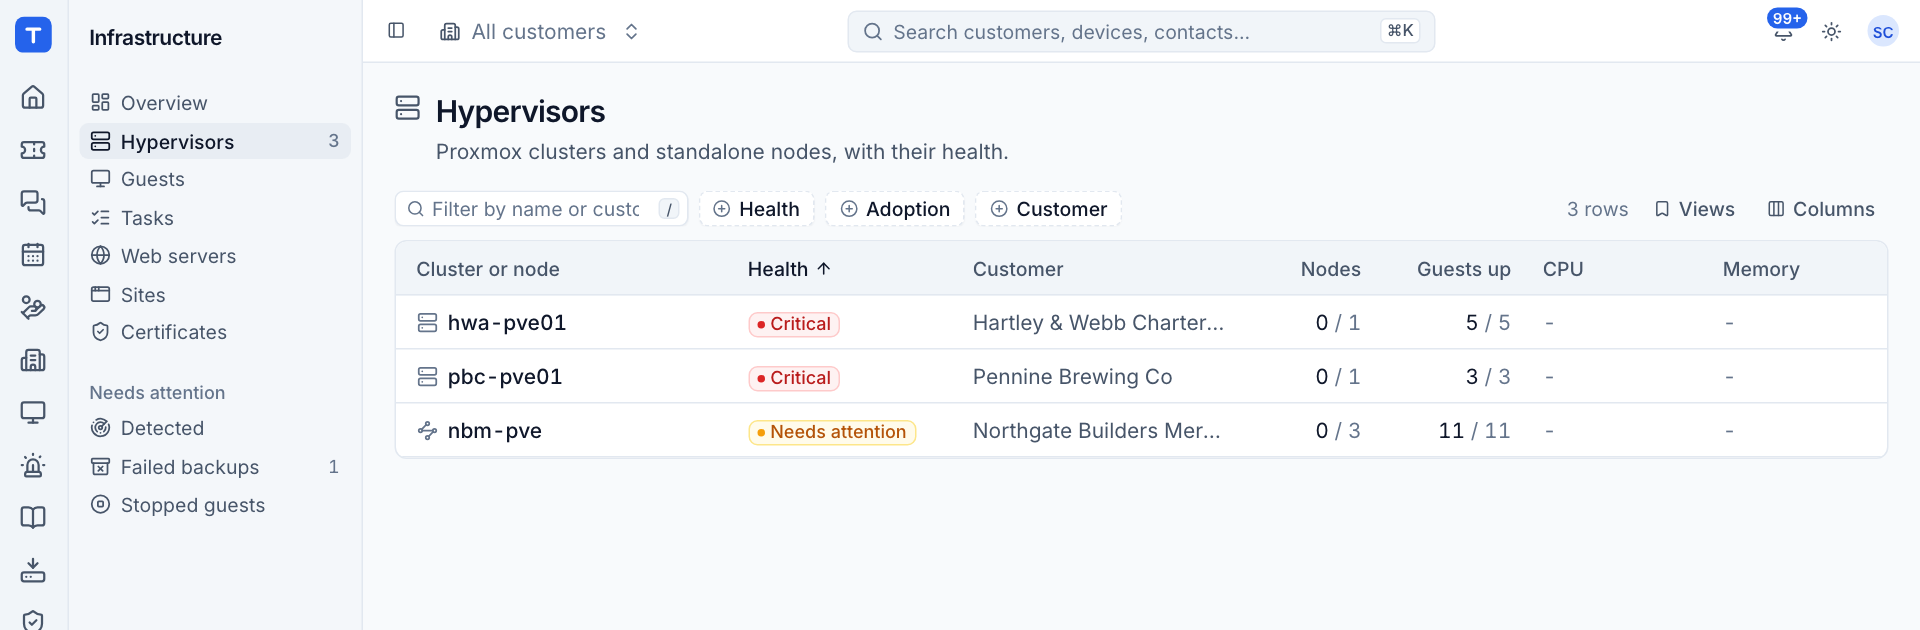
Health is Healthy, Needs attention or Critical, and the reasons show under the name: a node offline, the cluster losing quorum, storage filling up, a failed backup and so on.
The cluster page
Open a cluster to see:
- Customer, Nodes online, Guests running, Last report and who adopted it and when.
- The reasons for its current health, for example "Node hwa-pve01 is offline" or "Storage usb-backup on hwa-pve01 is 91.3% full".
- Nodes: each node's status, its device in Tenvara, address, CPU, memory, guests, cores and uptime.
- Guests: every virtual machine and container, filterable by status, type, node and last backup.
- Recent tasks, with a link to All tasks for the cluster.
- Storage: shared storage once, local storage per node, with type and space used.
- Backup jobs: the jobs scheduled in Proxmox (Datacenter > Backup), their schedule, target storage and next run.
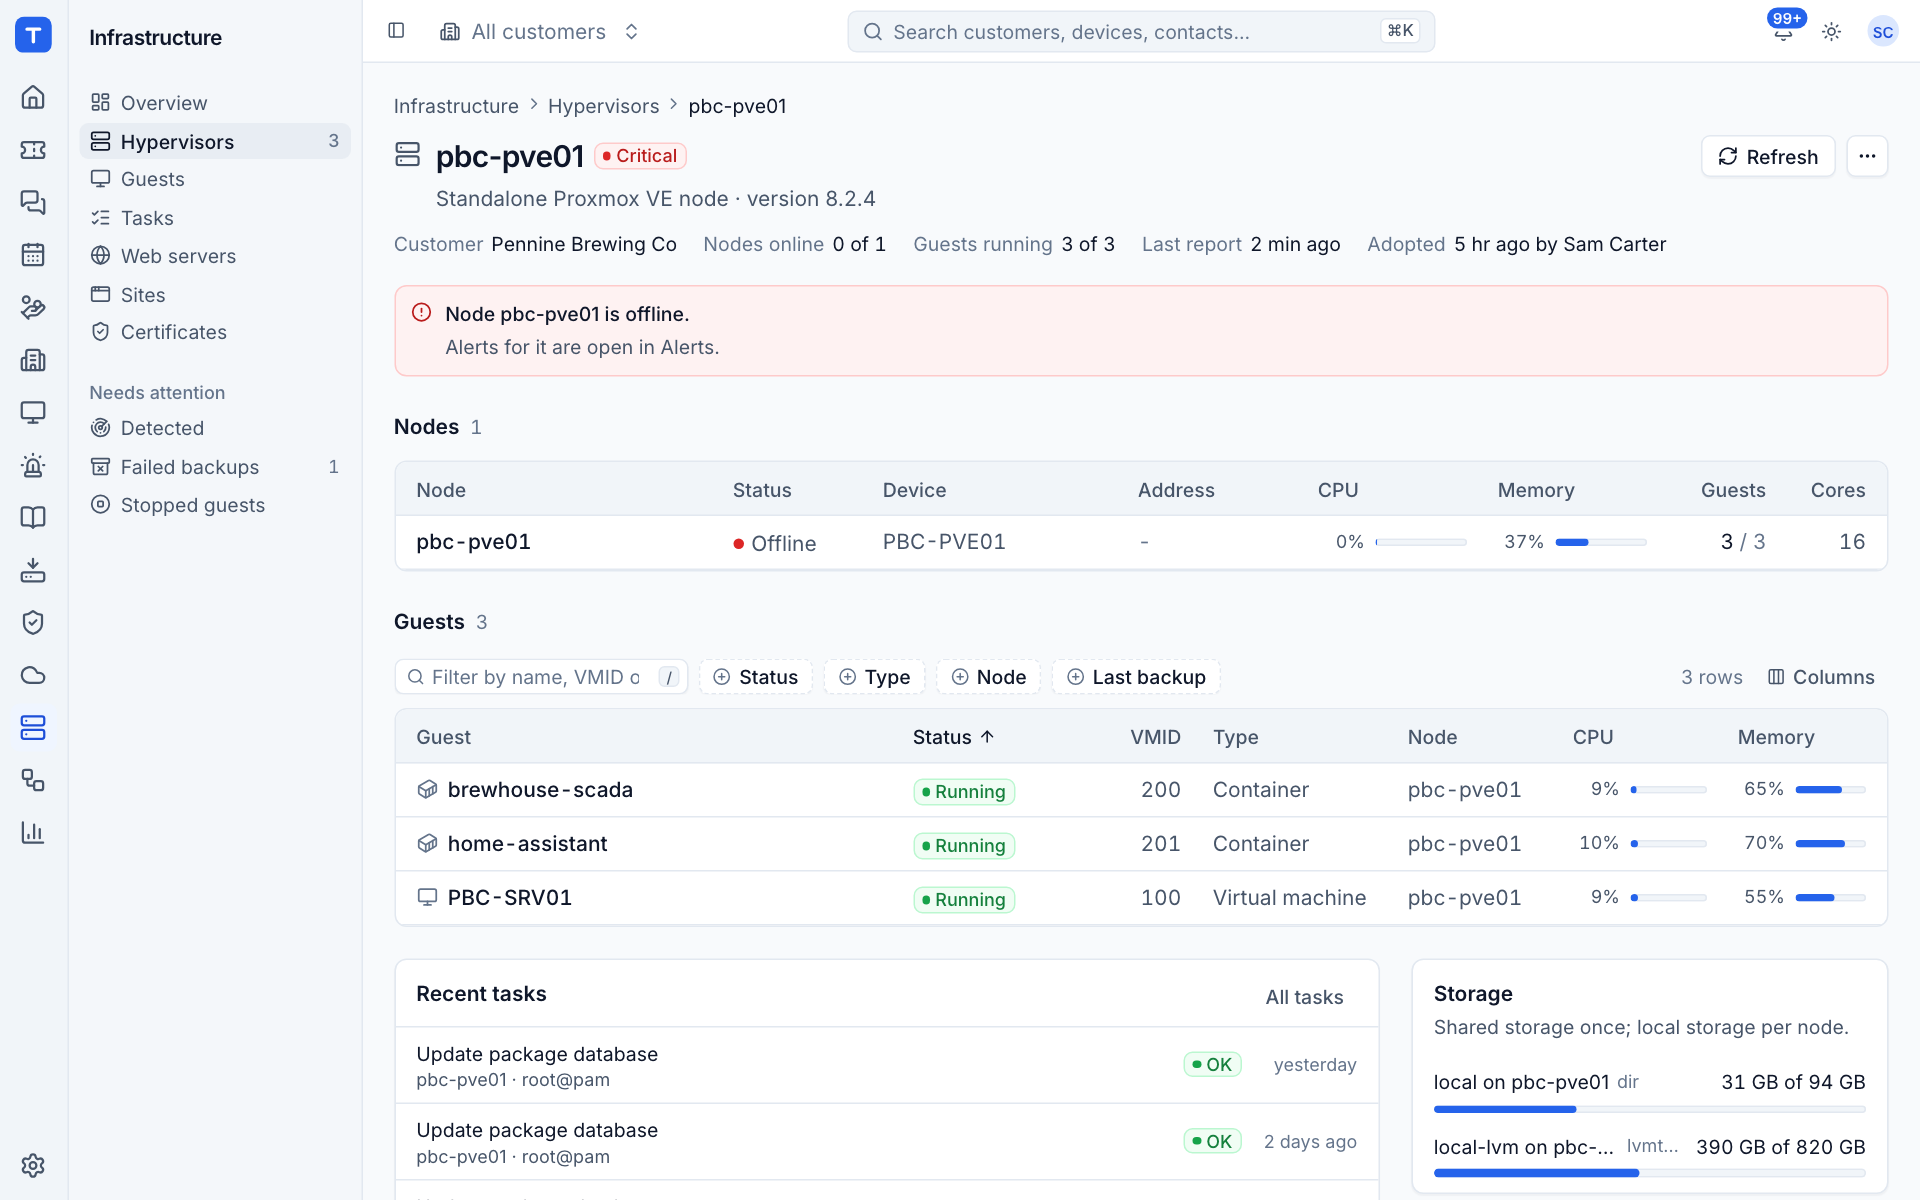
The header has Refresh, which asks a node for a fresh report now, and the More actions menu, where you can remove the cluster.
Removing a cluster
Removing (confirm with Remove) deletes the cluster's nodes, guests, tasks, backup history and charts from Tenvara and clears its alerts. Nothing changes on Proxmox. If one of its nodes still runs the agent, the cluster comes back as detected with its next report. Uninstall the agent from the nodes first if you want it gone for good.
The node page
Open a node from the cluster page to see:
- Host, its Device in Tenvara, Up for and Last report.
- Performance: hourly CPU, memory and network charts over 24h, 7d, 30d or 90d. History is kept for 400 days.
- Guests on this node.
- Now: CPU in use out of its cores, memory, swap, root disk, load average, CPU model and sockets, and kernel.
- Storage on the node and its Recent tasks.
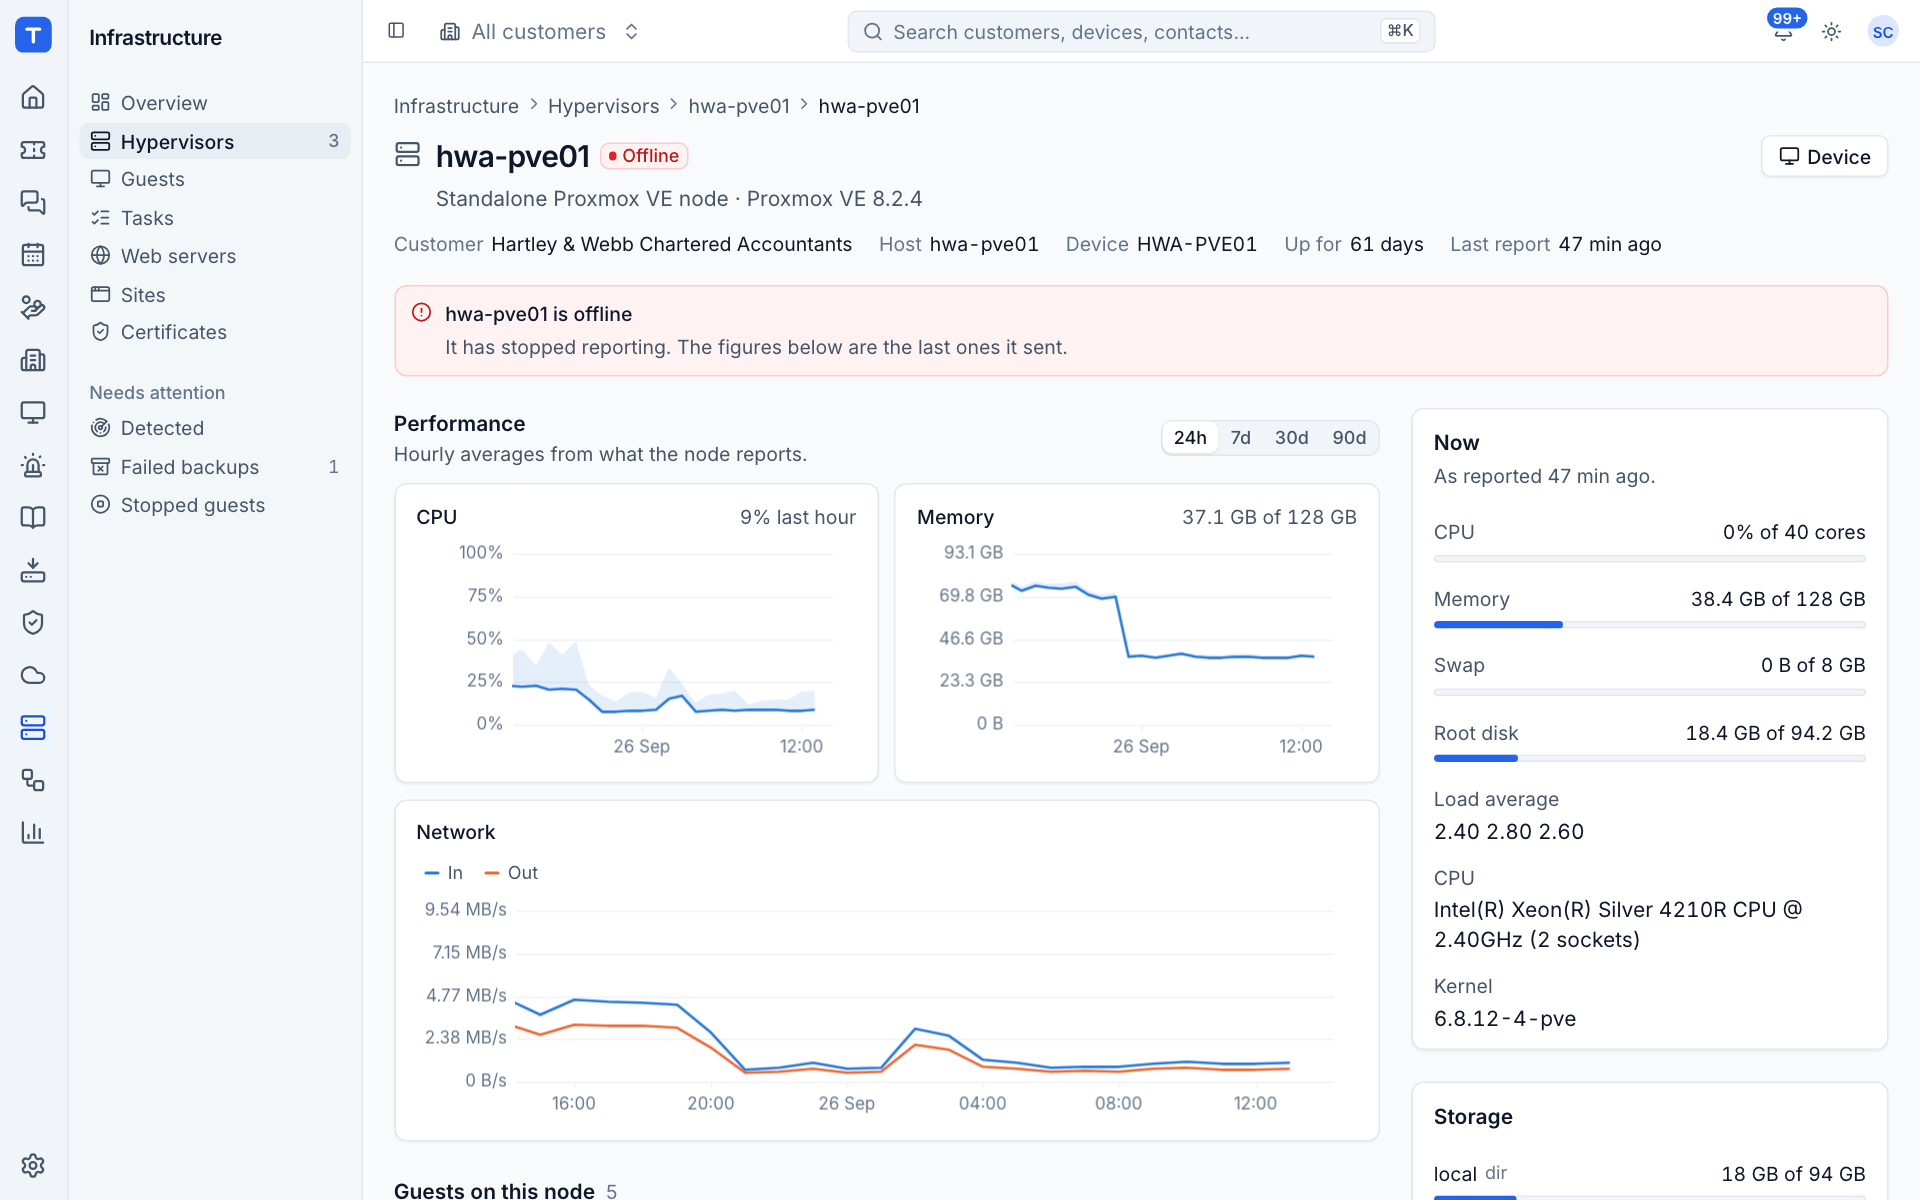
When a node stops reporting, the page says so ("It has stopped reporting. The figures below are the last ones it sent.") and keeps showing its last figures.
How nodes, guests and devices link up
- A node is linked to the device whose agent reports as that node.
- A guest that runs the Tenvara agent itself is linked to its own device, matched by its SMBIOS UUID, then a MAC address, then its hostname. The guest page shows it as Own device, and the guest's device page shows which host it runs on.
Standalone nodes and clusters
A node that was never clustered shows as a Standalone Proxmox VE node. If it later joins a cluster, its standalone record is merged into the cluster. A node removed from the cluster in Proxmox (pvecm delnode) is removed from Tenvara with its metrics and alerts.
Consoles
Browser consoles (noVNC and xterm.js) are not available in this version. Use Proxmox's own web interface, or Tenvara remote control on a guest that runs the agent.
Was this page helpful?
Thanks for the feedback.