How monitoring works
What the agent collects, how policies decide what each device checks and when it alerts, and where monitoring shows up in Tenvara.
Monitoring is part of the Tenvara agent. Every device with the Monitoring module on sends metrics (CPU, memory, disks, network, load and temperature where the system reports them), the state of its services, its patch status and the results of any checks you give it. Tenvara keeps the history, works out each device's health, and raises alerts when a threshold is crossed or a check fails.
There is no separate monitoring console. Monitoring shows up where you already work:
- Devices > Health: the whole fleet at a glance. See Device health.
- The device page: health, charts, checks, services, availability and the policies that apply.
- Alerts: every monitoring alert, with the chart around when it fired. See Alerts.
- The device list: Health and Fullest disk columns, and the Needs a look, Not reporting and Disks nearly full views.
- Customer pages and Home: each customer's device health, and a health card on Home.
- Settings > Monitoring: the policies.
Policies
What a device collects and when it alerts comes from policies. A policy holds settings, checks, thresholds and maintenance windows, and applies at one of four levels. From least to most specific:
- Global default: every device starts here. There is exactly one.
- Customer policies: change what a customer's devices do.
- Device group policies: change what a group's devices do, over their customer's policies.
- Device overrides: one device's own changes, over everything else.
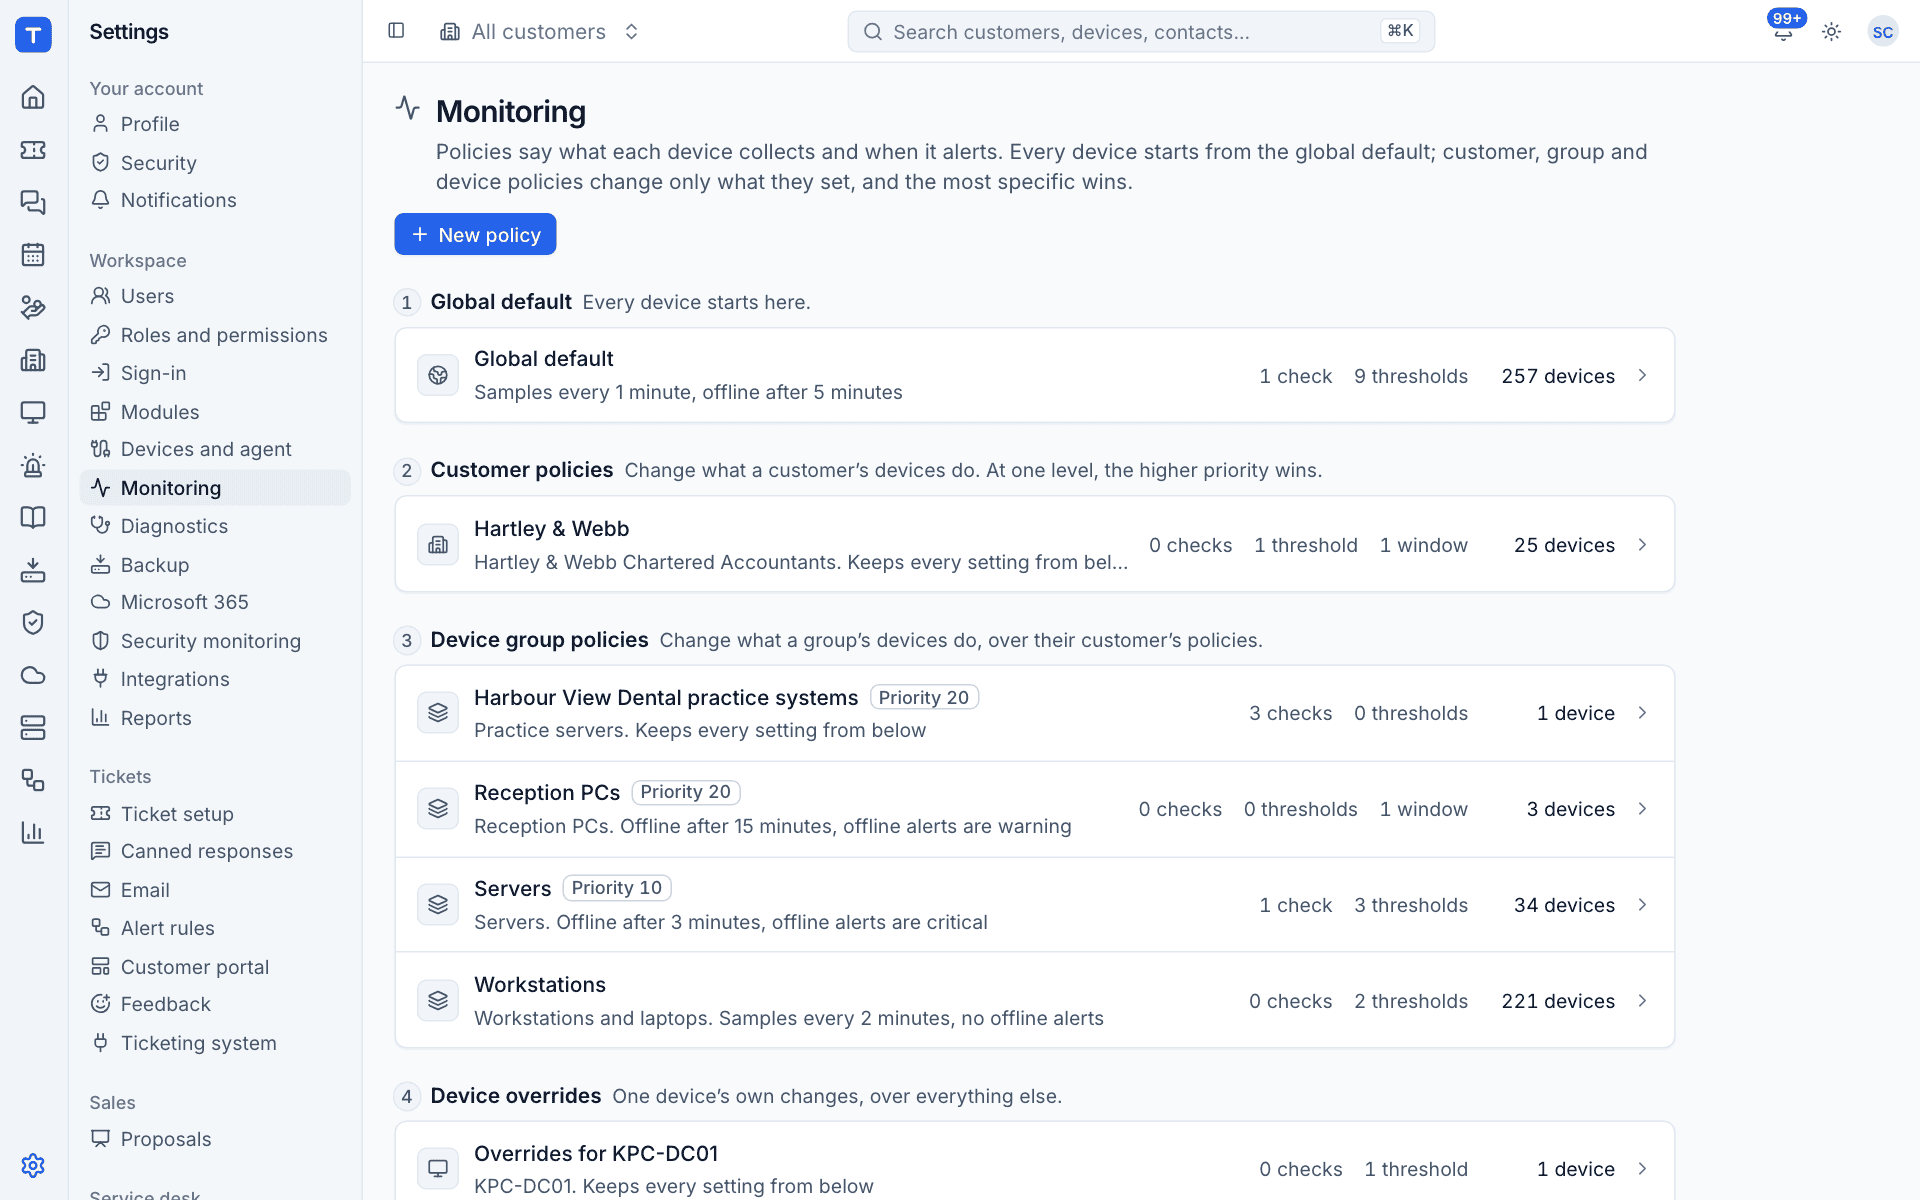
The most specific level wins. At one level, the policy with the higher Priority wins. A policy only changes what it sets:
- A setting left unticked is inherited from less specific policies.
- A check or threshold with the same key as one below it replaces it, so a customer policy can raise the CPU threshold or switch off the disk warning without copying everything else.
- Anything else is added.
For example, the Servers group policy in the demo sets offline after 3 minutes and a tighter disk warning, while Workstations turns offline alerts off, because workstations go home at night.
The global default
A new workspace starts with a global default that suits most MSPs:
| Rule | Default |
|---|---|
| Samples | every minute, offline after 5 minutes |
| CPU | above 90% for 10 minutes: warning |
| Memory | above 90% for 10 minutes: warning |
| Disks (every volume) | 85% or more for 5 minutes: warning; 95%: critical |
| Core Windows services | EventLog, Winmgmt, Schedule or Dnscache stopped for 2 minutes: critical |
| Certificates (from HTTPS checks) | expiring within 14 days: warning; 7 days: critical |
| Reboot pending | for 7 days: info |
| Critical updates | pending for 30 days: warning |
| Disk errors | an event log check on Windows for disk and NTFS errors in the System log |
| Offline | a critical alert after 5 minutes without contact |
Change any of these in Settings > Monitoring > Global default, or override them for a customer, group or device. See Policies, checks and thresholds.
Health
Each monitored device has a health:
| Health | Meaning |
|---|---|
| Healthy | Nothing is firing. |
| Warning | At least one warning is firing. |
| Critical | At least one critical alert is firing. |
| Offline | Nothing heard from the device for its policy's Offline after minutes. |
| Not monitored | No monitoring data yet, for example the module is off or the agent is not installed. |
"Needs a look" means critical or warning, or offline with its offline alert open. Workstations whose policy does not alert on offline are counted under Offline instead, so they do not bury the real problems.
Offline detection
A device that has sent monitoring data counts as offline when nothing has been heard from it (neither the agent's check-in nor monitoring data) for its policy's Offline after minutes. One is offline alert is raised per device, unless the policy turns offline alerts off, and it resolves as soon as the device is heard from again.
Note: Nothing resolves without evidence. When a device goes offline its other alerts stay open until data proves the problem has gone, and when it comes back each rule carries on from the device's own data.
History
Tenvara keeps every sample, 5-minute averages, hourly averages and check results for as long as you choose. The History part of Settings > Monitoring shows how much each takes and how far back it goes. Only administrators can change it. Shorter history uses less disk, and older data goes within a few hours of a change.
Was this page helpful?
Thanks for the feedback.