The report builder
Start from a template or from scratch, pick the data and period, filter, group, chart and export.
The report builder answers questions the dashboards do not: which customers had the most SLA breaches last quarter, which devices run an unsupported operating system, how much licence waste each customer carries. You pick the data, set a period and filters, choose how to group it, and the table and chart update as you go.
Opening the builder
Go to Reports > Report builder. The page lists:
- Saved reports: yours, and those colleagues shared that you are allowed to run, with their data, owner, schedule and when they last ran.
- Start from a template: ready-made reports grouped by category, with Find a template to search them. A padlock on a template means it needs a permission you do not have.
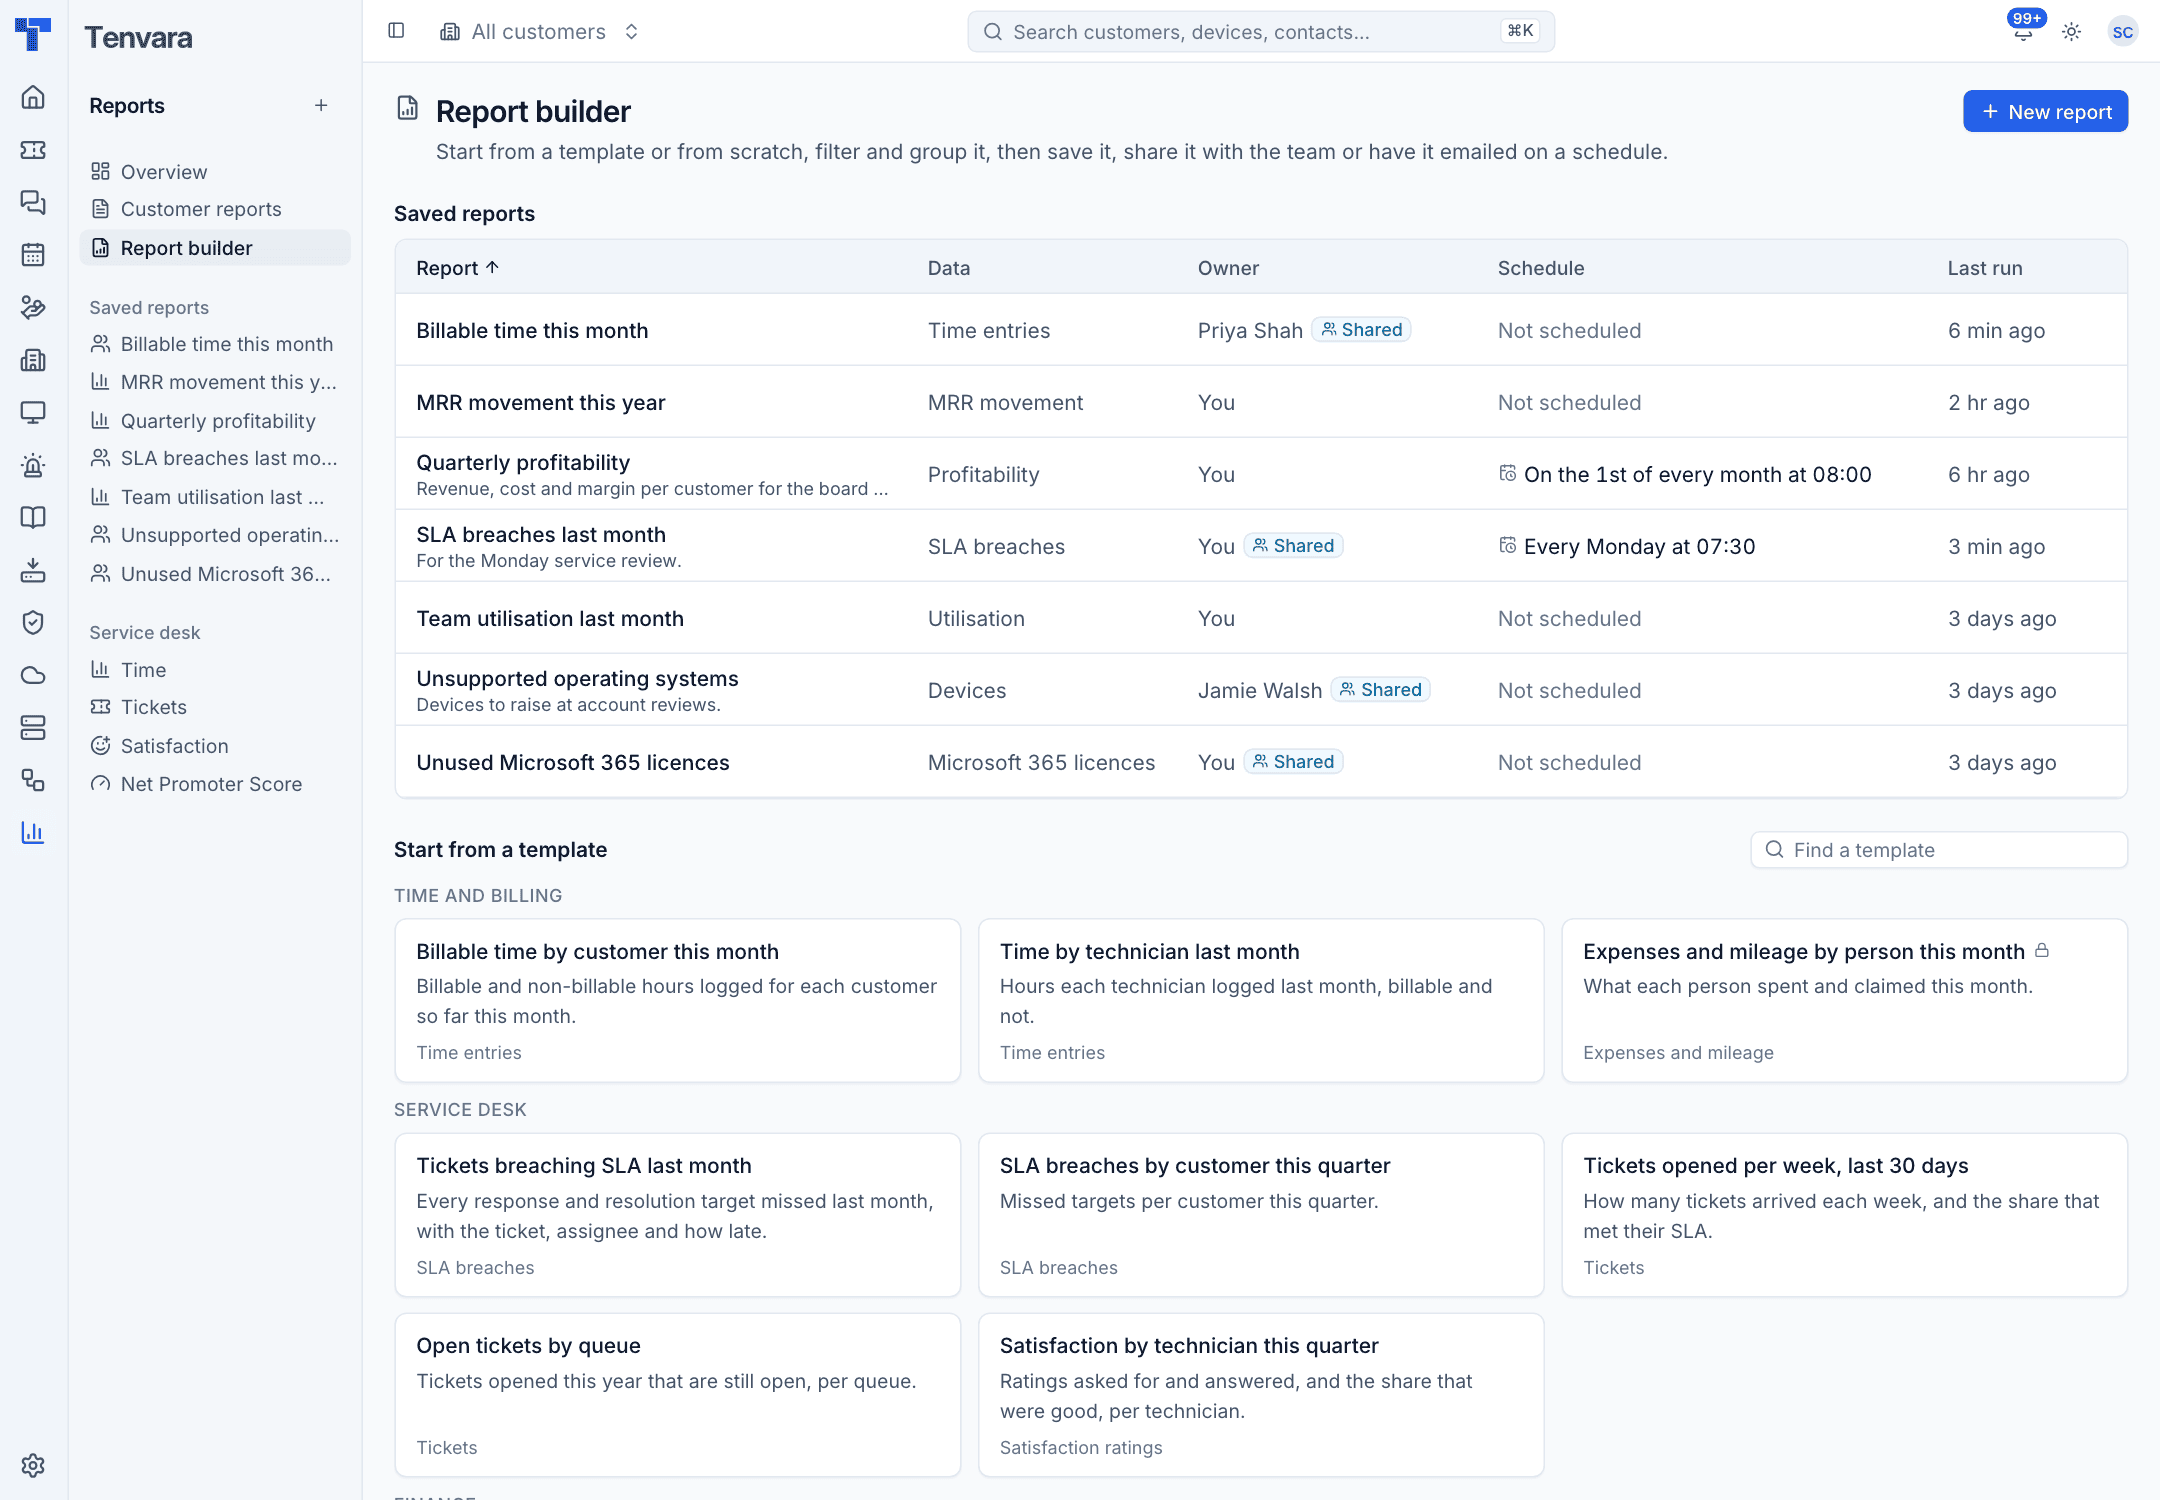
Press / to search and n to start a new report.
Templates
Templates cover the questions MSPs ask most often. They include:
| Category | Templates |
|---|---|
| Time and billing | Billable time by customer this month, Time by technician last month, Expenses and mileage by person this month |
| Service desk | Tickets breaching SLA last month, SLA breaches by customer this quarter, Tickets opened per week, Open tickets by queue, Satisfaction by technician this quarter |
| Finance | Profitability by customer last quarter, Least profitable customers this year, Technician utilisation, Utilisation by team, MRR movement this year, MRR by service, Churned customers this year |
| Licences | Licence waste by customer |
| Microsoft 365 | Unused Microsoft 365 licences, MFA coverage by customer, Users without MFA |
| Devices | Devices on unsupported operating systems, Devices by operating system, Patch compliance by customer, Outdated software |
Further templates cover failed backups, backup success, detections by severity, Cyber Essentials readiness, monitoring alerts, and quotes and win rate. A template only appears when its module is switched on.
Building a report
- Click a template, or New report to start from scratch.
- Under Report on, choose the data (the dataset). The line under it says what each row is.
- Set the Period. The label above it says what the period applies to, for example Period (opened) for tickets or Period (due) for SLA breaches.
- Pick a Customer, or leave All customers.
- Set any Filters.
- Choose Group by, or leave Nothing: every row.
- Tick the Columns you want, or for a grouped report, what to Show for each group.
- For a grouped report, pick a Chart.
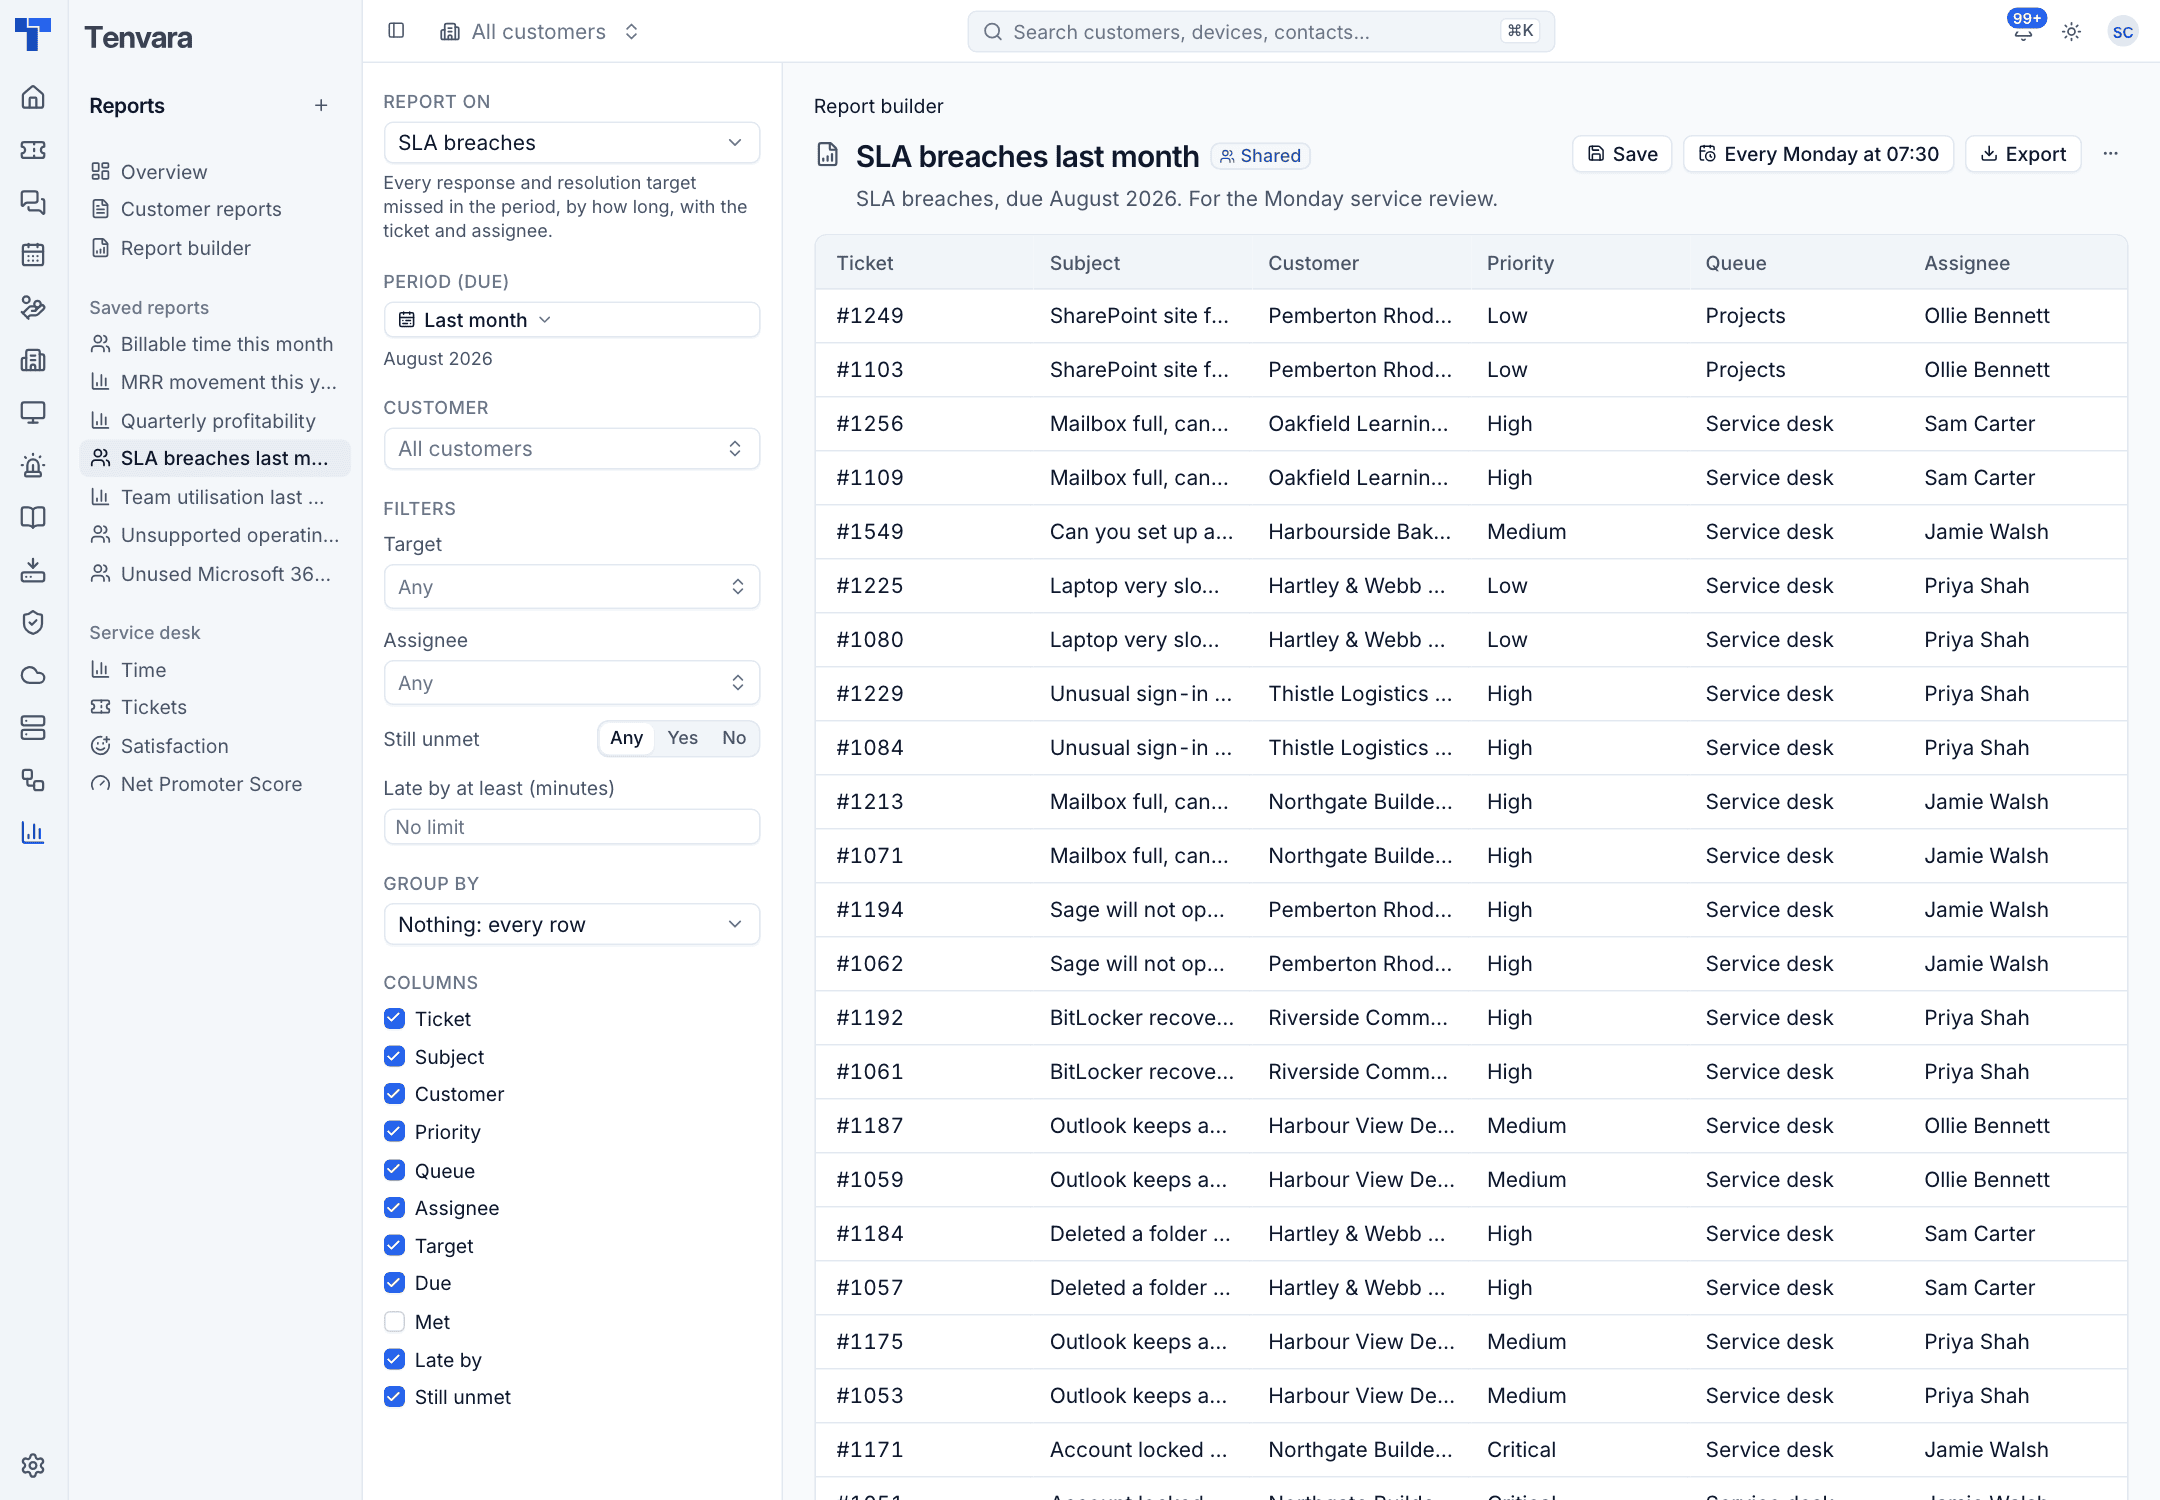
The report runs as you change it. Tables are sorted and paged by the server, 100 rows a page, with a total row for columns that add up. Customers, devices, tickets, users, quotes and contracts in the table link straight to them.
Periods
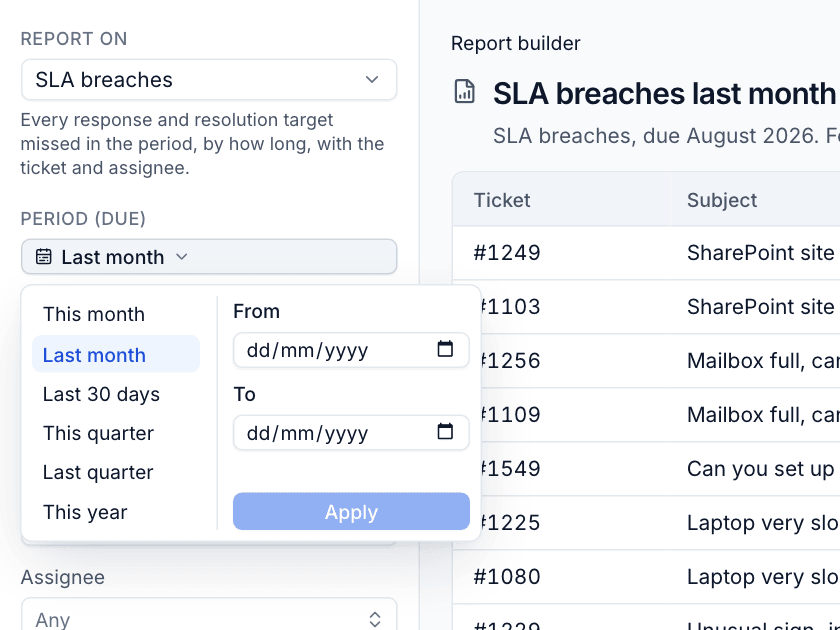
Choose This month, Last month, Last 30 days, This quarter, Last quarter or This year, or enter From and To dates and press Apply. Presets are worked out each time the report runs, so a saved "last month" report always shows the month just gone.
Some datasets describe things as they are now (devices, licences, Microsoft 365 users, software). For those the period does not apply.
Filters
Filters depend on the dataset. They come in a few kinds:
- A choice from a list, such as Assignee, Queue or Priority.
- Any, Yes or No, such as Still open or Billable.
- Text that a field contains, such as Subject contains.
- At least or at most a number, such as Late by at least (minutes).
Grouping and charts
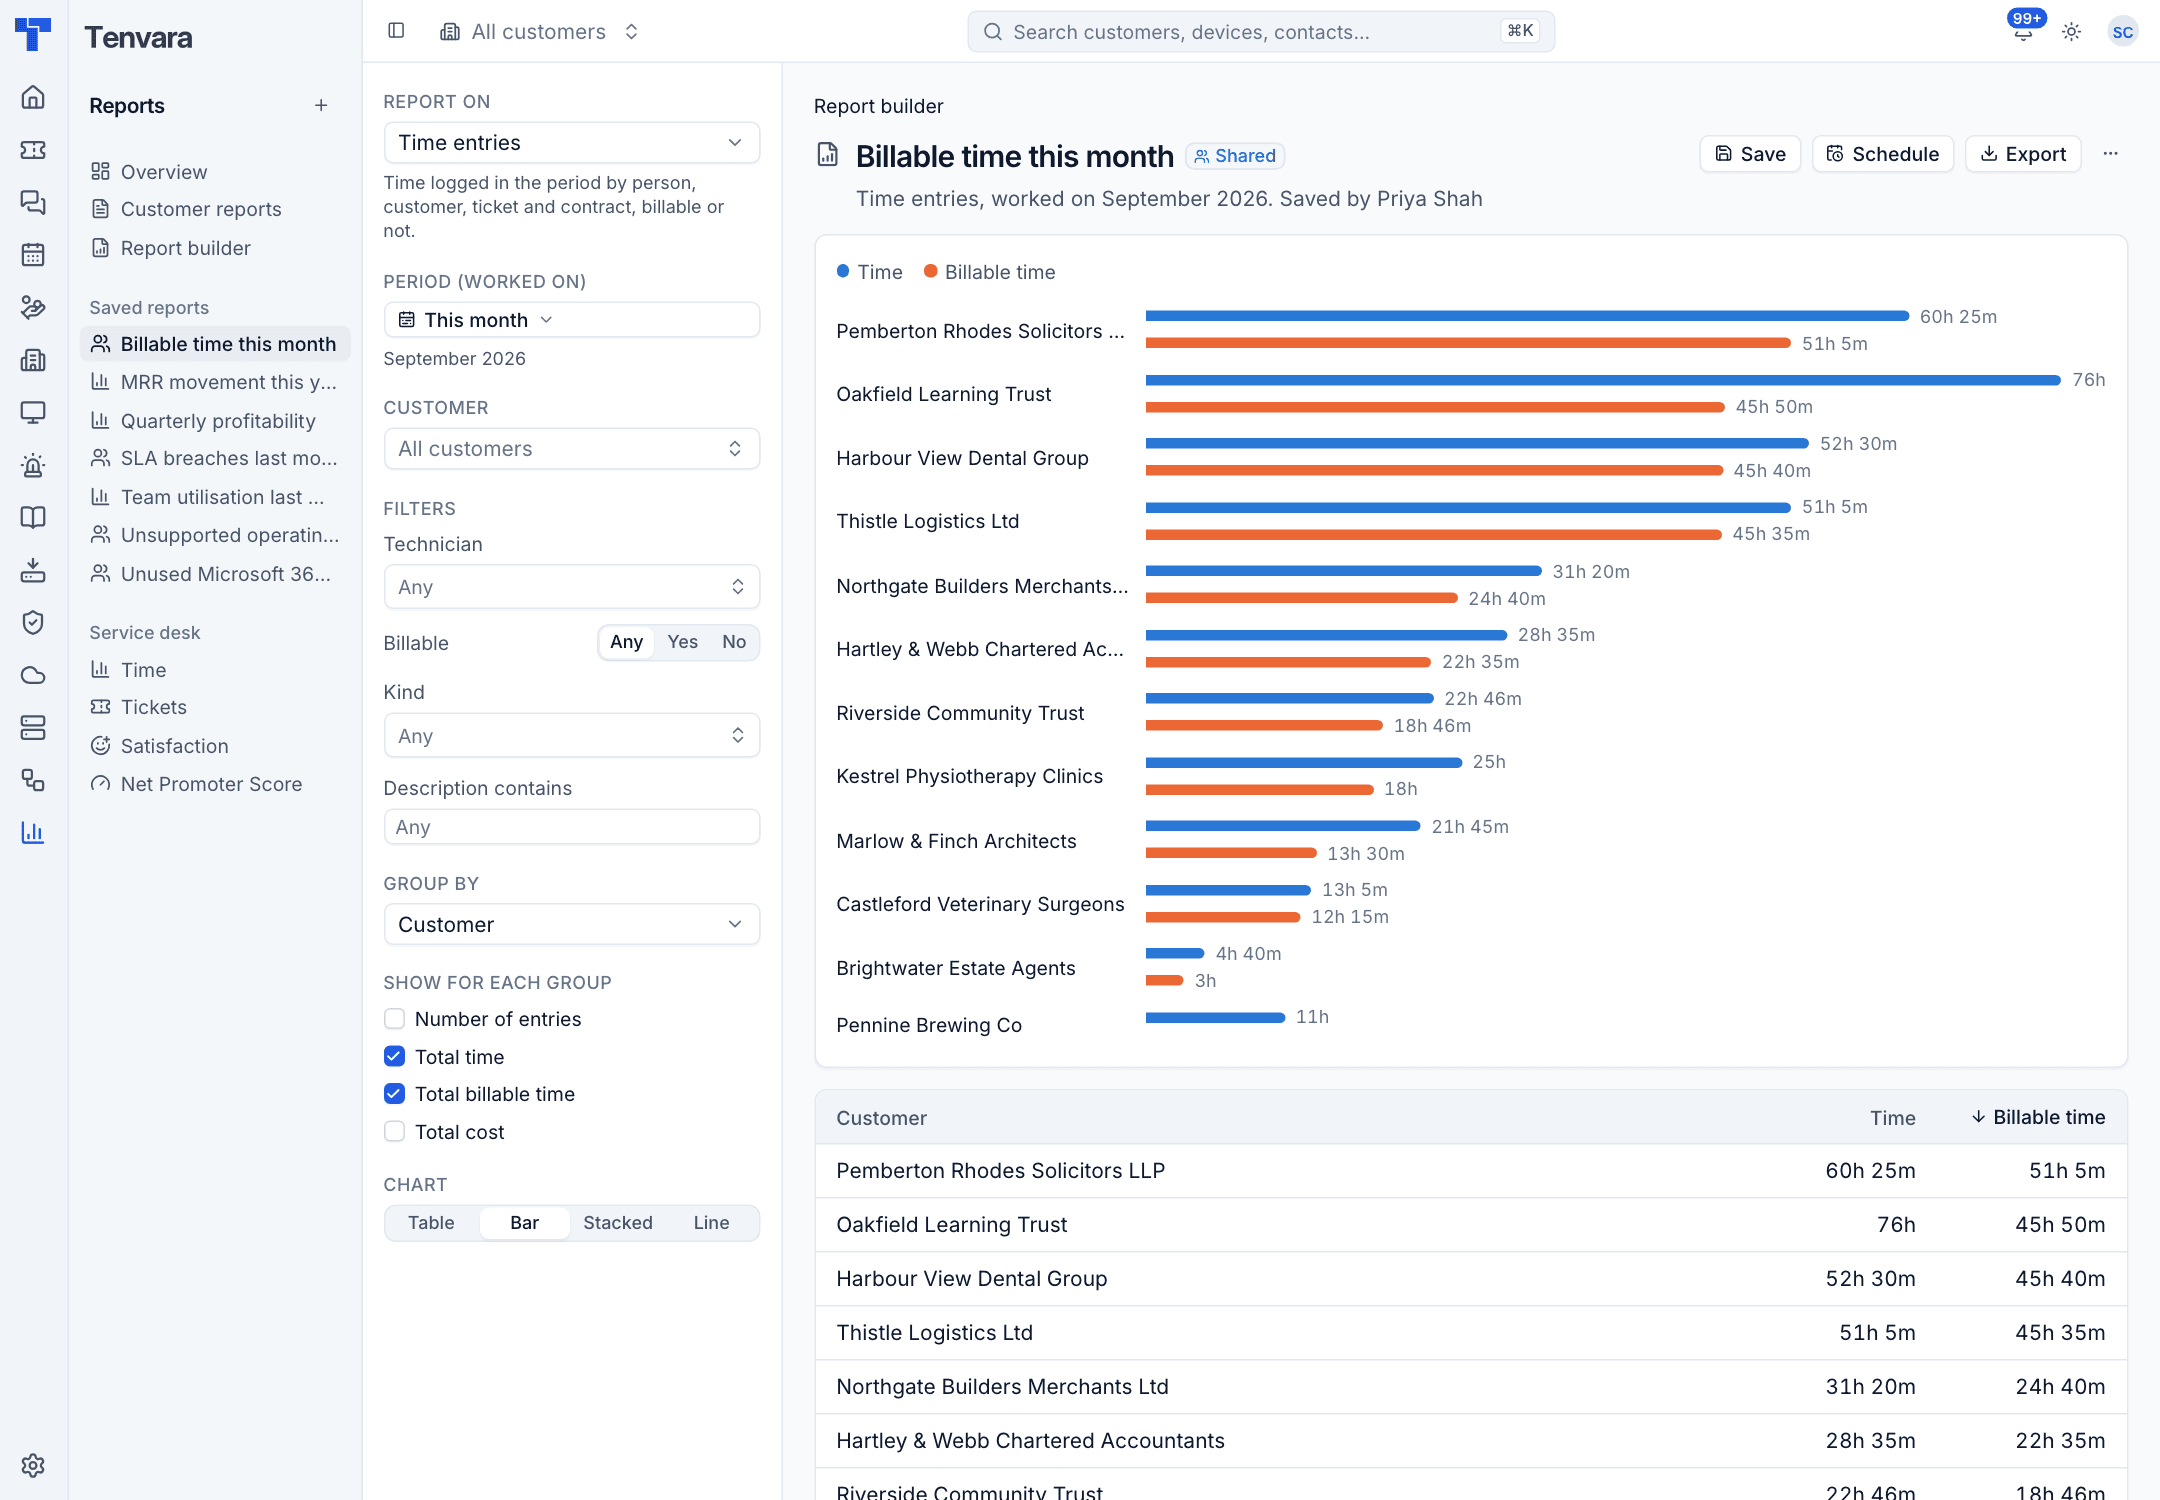
Group by collapses the rows into one per value, for example one row per customer. Date columns can be grouped by day, week, month, quarter or year. Then tick what to show for each group, such as Total time or Number of entries.
Grouped reports can be drawn as a Bar, Stacked or Line chart, or left as a Table.
The data you can report on
| Data | What each row is |
|---|---|
| Tickets | A ticket, with status, priority, type, queue, assignee, source, SLA and time logged |
| SLA breaches | A missed response or resolution target, with how late it was |
| Time entries | A time entry, with its kind and cost at the person's cost rate |
| Utilisation | A person, with expected, logged and billable hours |
| Profitability | A customer, with every revenue and cost part and margin |
| Recurring revenue and MRR movement | MRR and ARR per customer and service, and how it moved |
| Contracts | A contract, with fee, included hours, overage rate and recurring lines |
| Licence subscriptions | Seats, assigned, unused, monthly cost, billed, margin and waste |
| Devices | A device, with operating system, whether it is still supported, hardware and last seen |
| Patch compliance and Software installs | A device's patch state, and each installed package with any update |
| Backup jobs | An endpoint or Microsoft 365 backup job |
| Security detections and Cyber Essentials | A detection, and each customer's readiness |
| Microsoft 365 users and MFA and Microsoft 365 licences | A user with MFA state, and each tenant licence |
| Alerts | Alerts from every module, how often and how long open |
| Satisfaction ratings, Expenses and mileage and Quotes | A rating, a claim, or a quote with its value and win rate |
Permissions are checked every time a report runs. Money columns, such as a time entry's cost or a quote's margin, only show to people with Finance view.
Exporting
Click Export and choose:
- CSV (every row): all rows up to 50,000, with units in the column headers.
- PDF: the title, what the report covers, its filters, the chart and the table with its total. Wide reports turn to landscape.
To keep the report, or have it emailed on a schedule, see Saved and scheduled reports.
Was this page helpful?
Thanks for the feedback.