Network intrusion detection
Turn a Linux device with the Tenvara agent into a Suricata network sensor on a switch mirror port, and get its alerts as detections, with the sensor's health watched for you.
A network sensor watches the traffic on a customer's network and raises detections for what it sees: malware calling home, exploit attempts, a PC sweeping the LAN. It is a Linux device with the Tenvara agent running Suricata, either on a switch's mirror (SPAN) port, where it sees the whole network, or watching its own traffic. Tenvara installs Suricata, keeps its rules up to date and checks that it is working.
What you need
- A Linux device with the Tenvara agent, running as root, on Ubuntu or Debian. A small box is enough.
- For whole-network visibility, a switch port that mirrors the traffic you want to watch, connected to a spare network interface on that box.
- Security collection switched on for the device (see Event sources and collection).
Sensors are Linux only. Windows and macOS agents say so if you try.
Adding a sensor
- Go to Security > Network sensors and press Add sensor. (Or open the device page and use Make it a network sensor in its Network sensor block.)
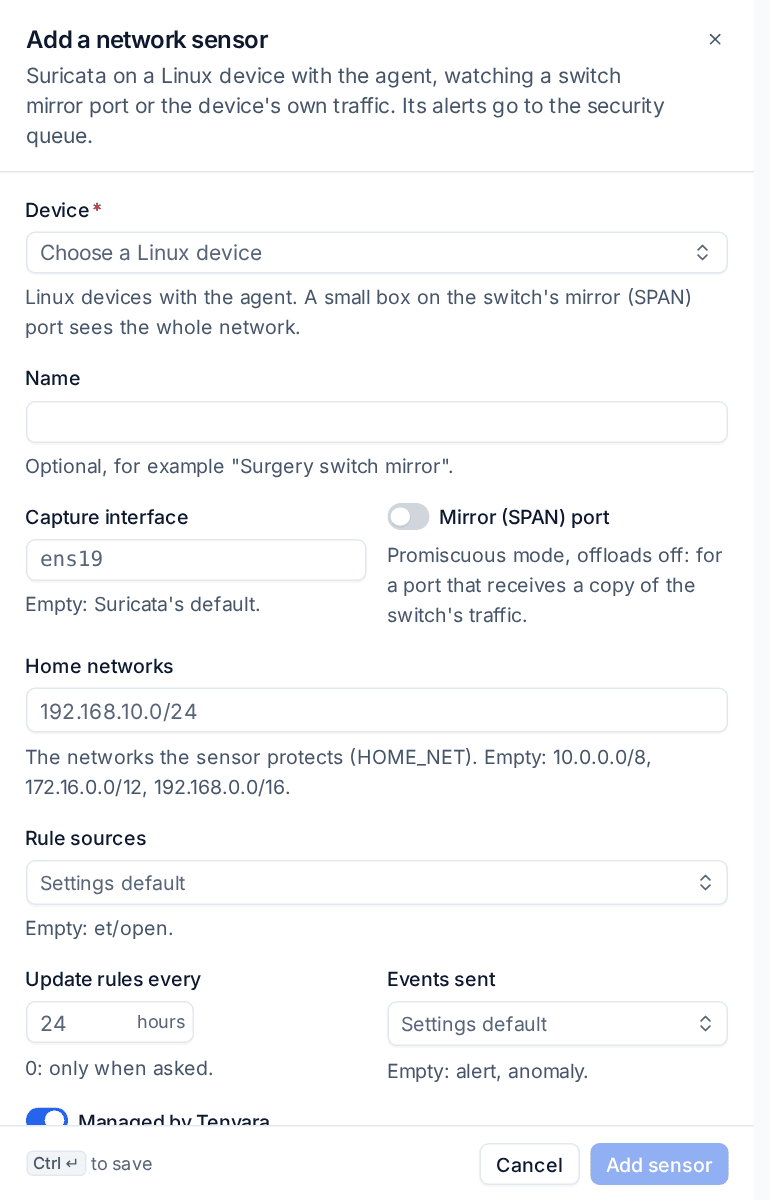
- Choose the Device. Only Linux devices with the agent are offered.
- Give it a Name, for example "Surgery switch mirror".
- Choose the Capture interface. Leave it empty for Suricata's default.
- Switch on Mirror (SPAN) port if that interface receives a copy of the switch's traffic. Tenvara then puts it in promiscuous mode with offloads off.
- Set Home networks: the networks the sensor protects. Left empty, the private ranges are used.
- Leave Rule sources, Update rules every and Events sent at the Settings defaults unless this sensor needs different ones.
- Leave the managed switch at the bottom of the form on so Tenvara installs Suricata and applies the settings, then press Add sensor.
Tenvara installs Suricata and suricata-update through software deployment, downloads the rules (ET Open by default), starts Suricata with your settings and begins reading its alerts. The device's own Suricata configuration file is left as it is: the managed settings are applied alongside it, so a distribution update keeps its own configuration.
Tip: If you would rather run Suricata yourself, switch managed off. The agent then only reads Suricata's alerts.
The sensors list
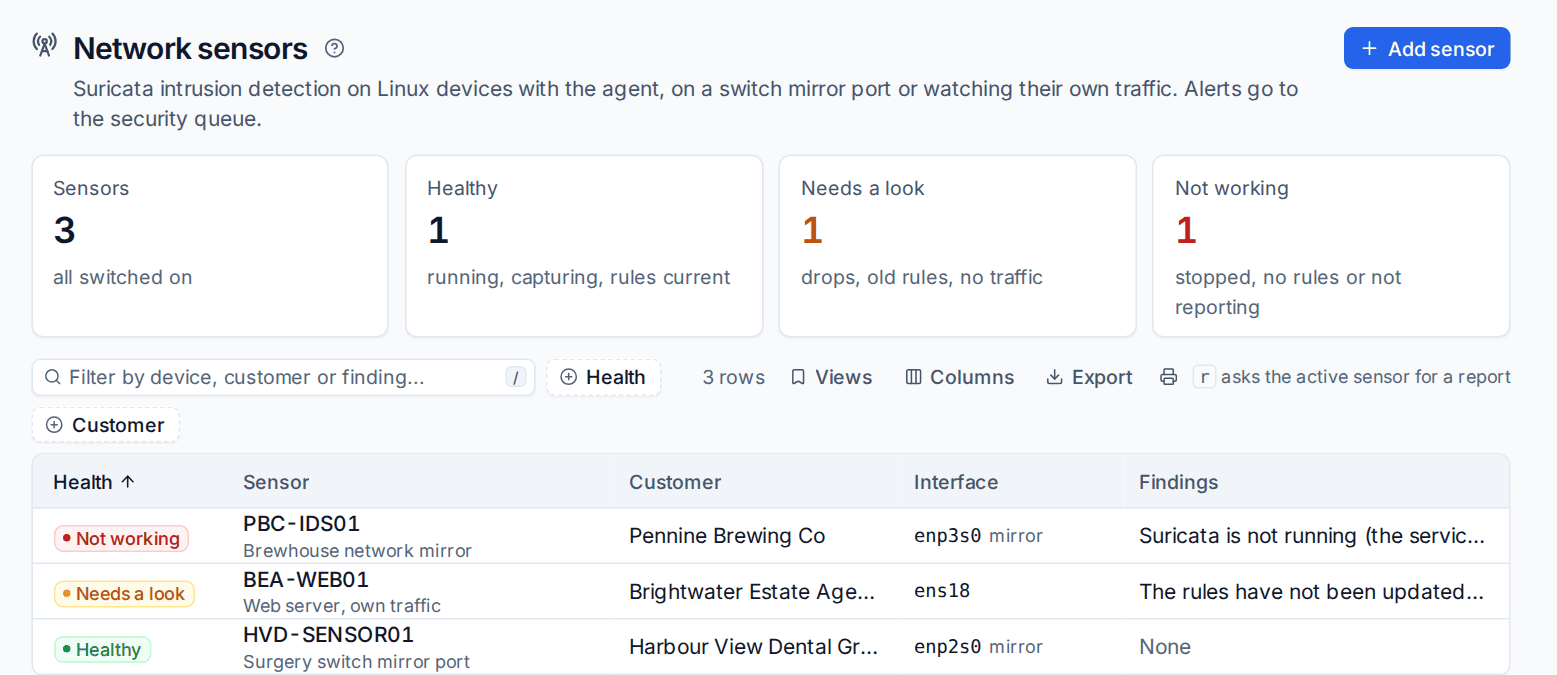
The top counts Sensors, Healthy (running, capturing, rules current), Needs a look (drops, old rules, no traffic) and Not working (stopped, no rules or not reporting). Each sensor shows its health, customer, interface and what is wrong.
Click a sensor's row to open its panel:
- Findings: what is wrong, worst first, for example "Suricata is not running" or "There is no network interface enp3s0 on the device".
- Suricata's version and state, the capture interface, rules loaded and when they were updated, packets seen, how long it has been running, alerts and the last alert, home networks and the events sent.
- Network interfaces on the device with their addresses, so you can pick the right one.
- The last error in Suricata's log.
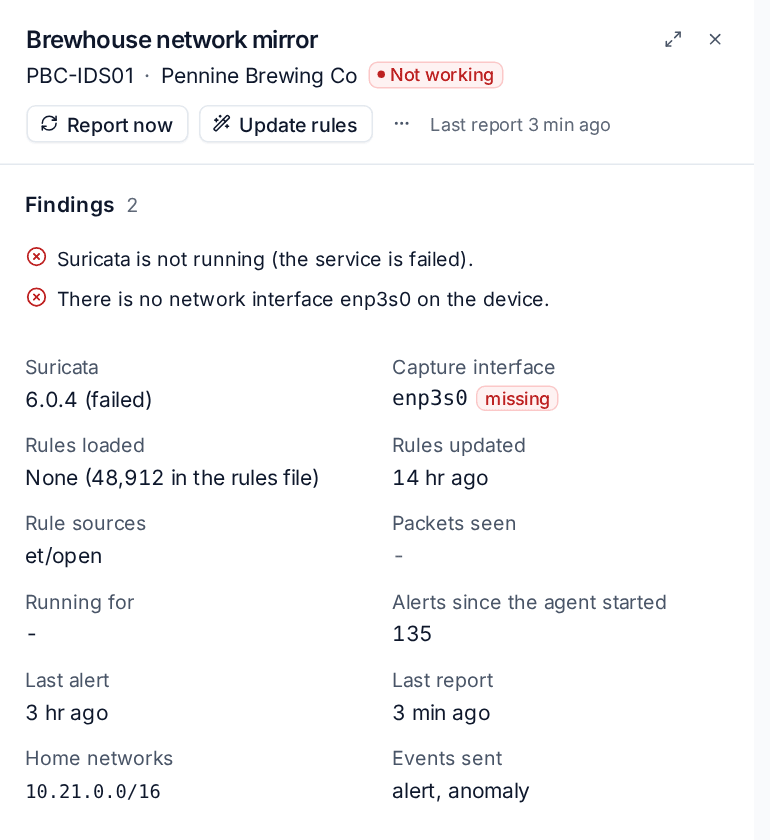
From the panel use Report now to ask the sensor for a fresh report, Update rules to update them now, and the ... menu to install or repair Suricata, change its settings, search its alerts or stop using the device as a sensor. Press r on the list to ask the active sensor for a report.
Sensor health
A sensor reports every five minutes. It needs a look, or stops working, when:
- It is not reporting while the device is online, or the agent is not running as root.
- Suricata is not installed, not running, or the settings could not be applied.
- The capture interface is missing or down, or a mirror port is not in promiscuous mode.
- No rules are loaded, the rules are older than allowed (3 days by default), or the last update failed.
- No packets arrive after five minutes, or drops are over the allowed share (5% by default).
A sensor that stops working raises one alert (critical by default), kept up to date while it stays broken and cleared when it recovers.
What sensors find
Suricata's alerts arrive as security events (dataset network.ids) on the sensor's device and customer, with the source and destination addresses of the traffic, the signature and its category. Malware, trojan, command and control and exploit kit alerts are at least high severity. Search them in Security > Events.
Three built-in rules turn them into detections:
- A high or critical alert: one detection per signature and source address.
- A burst of alerts: 20 alerts about one source in 15 minutes.
- Lateral movement: one internal address with alerts against five or more other internal addresses within 30 minutes, which an edge firewall never sees.
Detections go through the usual queue, alerts and tickets: see Working detections.
Settings
Settings > Security monitoring > Network sensors (administrators) sets the defaults for every sensor: rule sources (ET Open, plus the free sources suricata-update offers), how often rules update (24 hours), which event types are sent (alerts and anomalies; DNS, HTTP, TLS and flow records are far more and are your choice), home networks (per customer too), the report interval, when a sensor counts as not reporting, the drop share and rule age that need a look, and whether a broken sensor raises an alert and at what severity. Saving updates every sensor.
Was this page helpful?
Thanks for the feedback.