SNMP monitoring and traps
Poll switches, firewalls, access points, UPS units, printers and NAS boxes over SNMP v2c or v3 through the site's probe, with editable vendor templates, alerts and trap rules.
Network kit cannot run the agent, but nearly all of it speaks SNMP. The site's network probe polls it for you, and the results go into the same charts, thresholds and alerts as any computer's. Traps the kit sends are received by the probe too, and trap rules decide which ones matter.
You need a network probe at the site first. See Network discovery and topology.
SNMP credentials
Credentials belong to a site, so kit at different customers never shares a community string.
- Open the site from Devices > Network and go to Probe and credentials.
- Click Add credential and give it a Name.
- Choose the Version:
- v1 or v2c: enter the Community. Read-only is enough.
- v3: enter the User name, the Authentication method (MD5 up to SHA-512) and Authentication password, and the Privacy (encryption) method (DES or AES) and Privacy password. Context is usually empty.
- Save, then click Test to try it against a device address.
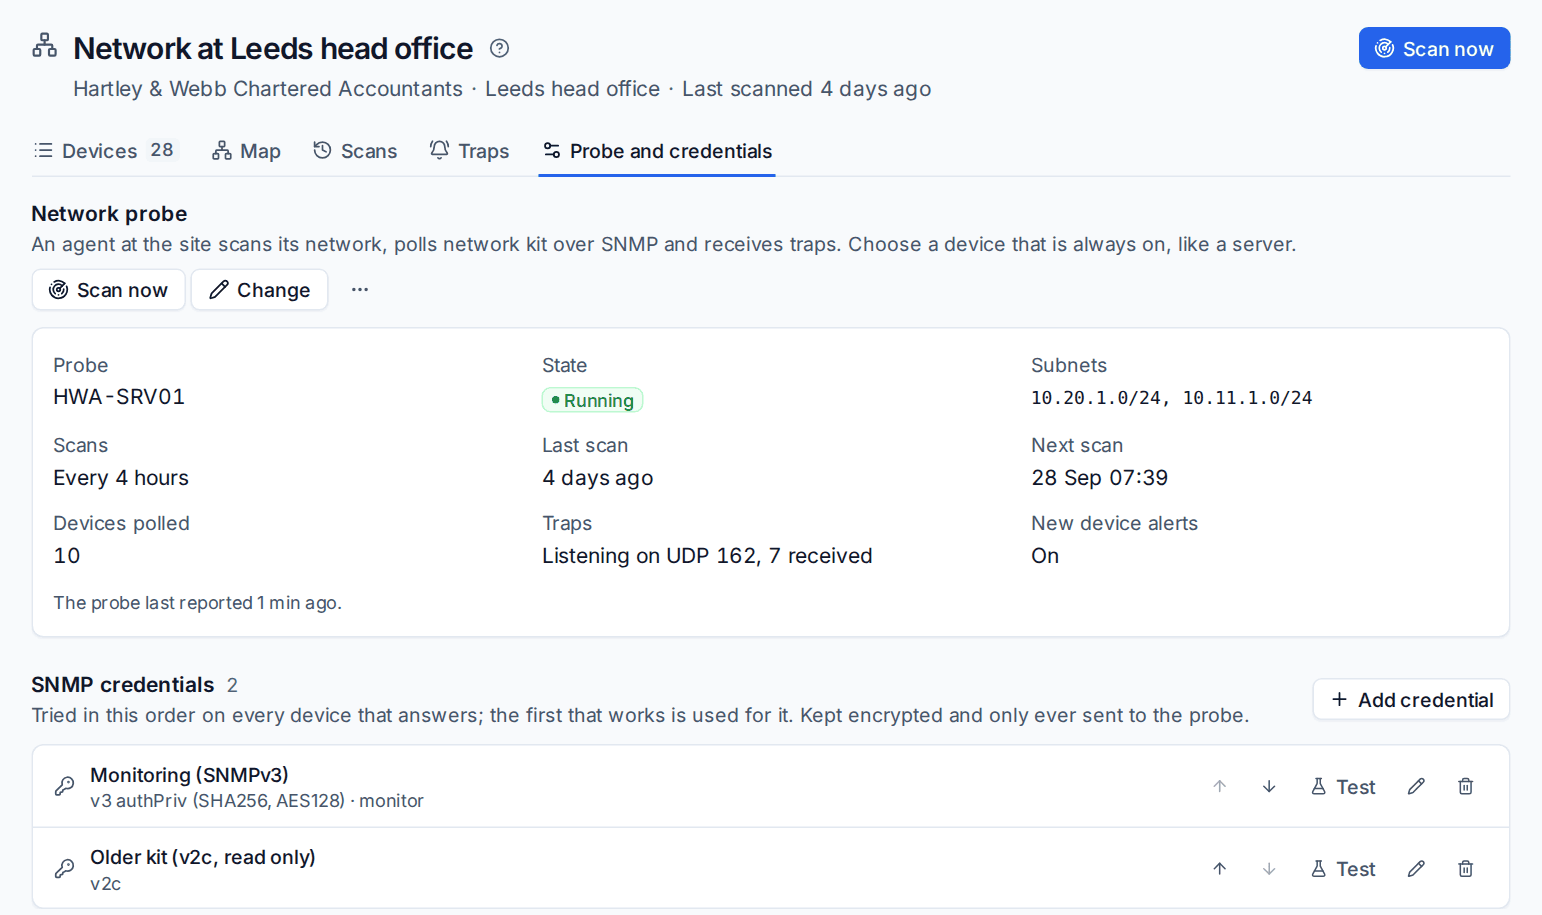
Credentials are tried in order on every device that answers; the first that works is used for it. Use the arrows to change the order. Secrets are stored encrypted, are never shown again, and are only ever sent to the site's probe.
Tip: Use SNMP v3 with authentication and privacy wherever the kit supports it, and keep a v2c credential below it for older kit.
Monitoring a device
A device adopted from a scan is polled automatically when it answered SNMP. For other kit, open the device and click Monitor over SNMP.
The device page then has an SNMP monitoring section.
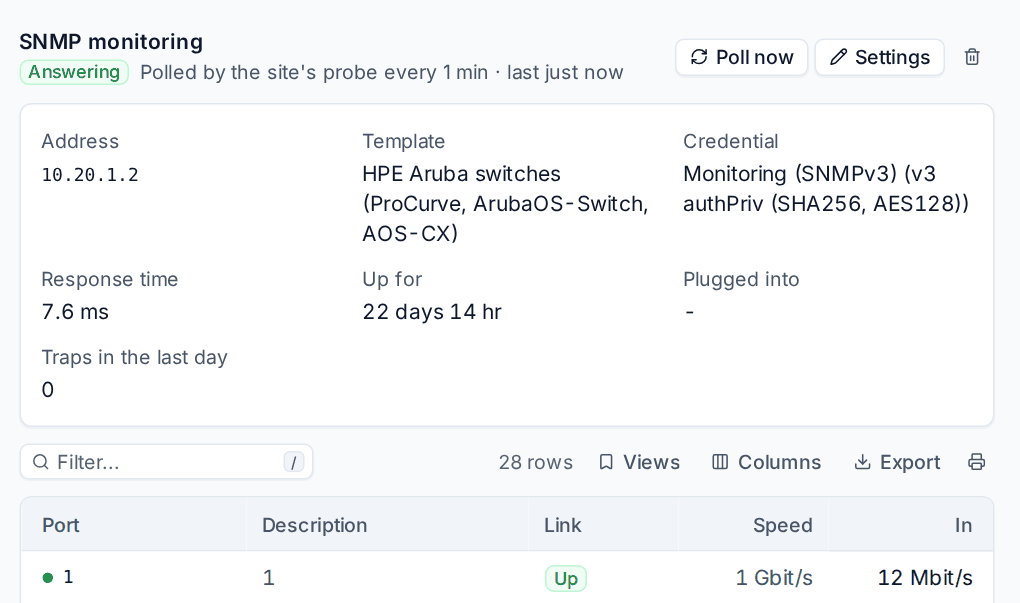
- Whether the device is Answering, how often it is polled and when it was last polled. Poll now polls straight away; Settings changes the address, credential, template, interval and which interfaces are watched.
- The template in use, the credential, the response time, how long it has been up, which switch port it is plugged into and the traps it sent in the last day.
- The interfaces table: link state, speed, traffic in and out, how busy each port is and errors. Pick a port for its traffic chart.
- Depending on the kit: the UPS (on battery, charge, load, runtime, input voltage and battery replacement), printer supplies, wireless clients or firewall sessions.
CPU, memory, temperatures, disks and the busiest ports also appear in the device's health charts, and the thresholds and alert rules of its monitoring policies apply to them as they do to a computer. A device that stops answering raises an alert that it is not answering SNMP after the number of failed polls you set; the next good poll clears it.
Polling settings
Under Settings > Network > SNMP monitoring:
| Setting | What it does |
|---|---|
| Poll every | How often monitored kit is polled, in seconds. A device can have its own. |
| Interfaces to watch | All except loopbacks, Only those switched on or Only the ones I choose, for newly monitored devices. |
| Alert when a device stops answering after | How many polls in a row without an answer raise the alert. |
| Not answering alert severity | Information, Warning or Critical. |
Templates
A template says what to poll on a kind of kit. Tenvara comes with 19 built-in templates: Cisco IOS and IOS XE, HPE Aruba switches, Ubiquiti UniFi, Fortinet FortiGate, SonicWall, WatchGuard Firebox, DrayTek Vigor, MikroTik RouterOS, Netgear, APC Smart-UPS, Eaton UPS, Synology, QNAP, any UPS, any printer, Windows, Linux, the host resources MIB and a generic template for anything else.
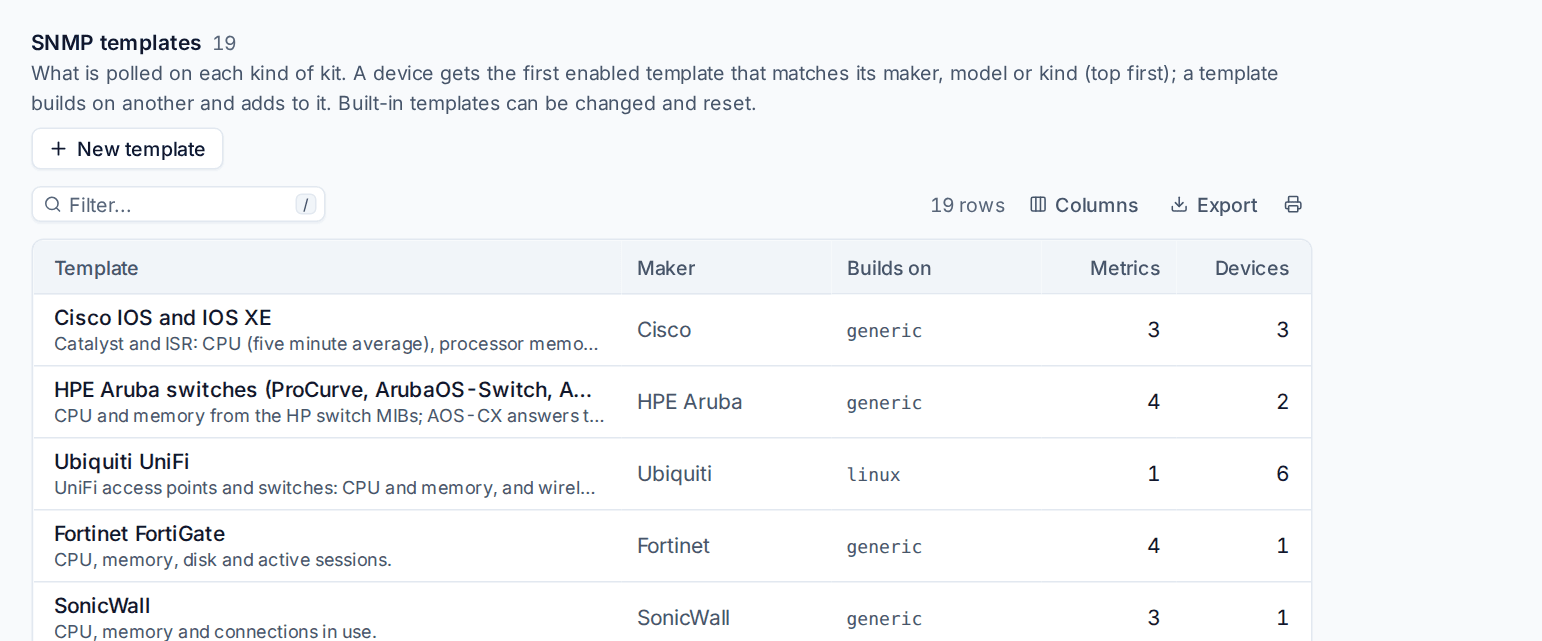
Go to Settings > Network > SNMP templates. A device gets the first enabled template that matches its maker, model or kind, from the top. A template can build on another and add to it.
- Click a template to change it. Each metric reads one value, walks a column or table, or combines several values with a simple formula; options cover rates for counters, scaling, limits and turning status codes into numbers.
- Use the SNMP walk to see what a device actually answers before you add a metric.
- New template adds your own, for kit the built-in ones do not cover.
Built-in templates can be changed and reset. Your changes are kept when Tenvara is updated.
Traps
Traps are messages kit sends when something happens, such as a port going down or a UPS switching to battery. The probe listens for them (UDP port 162 by default) and Tenvara matches each one to its device and to the first trap rule that fits.
Point your kit's trap destination at the probe's address. A trap whose community or v3 user is not one of the site's credentials is logged as Not recognised and raises nothing.
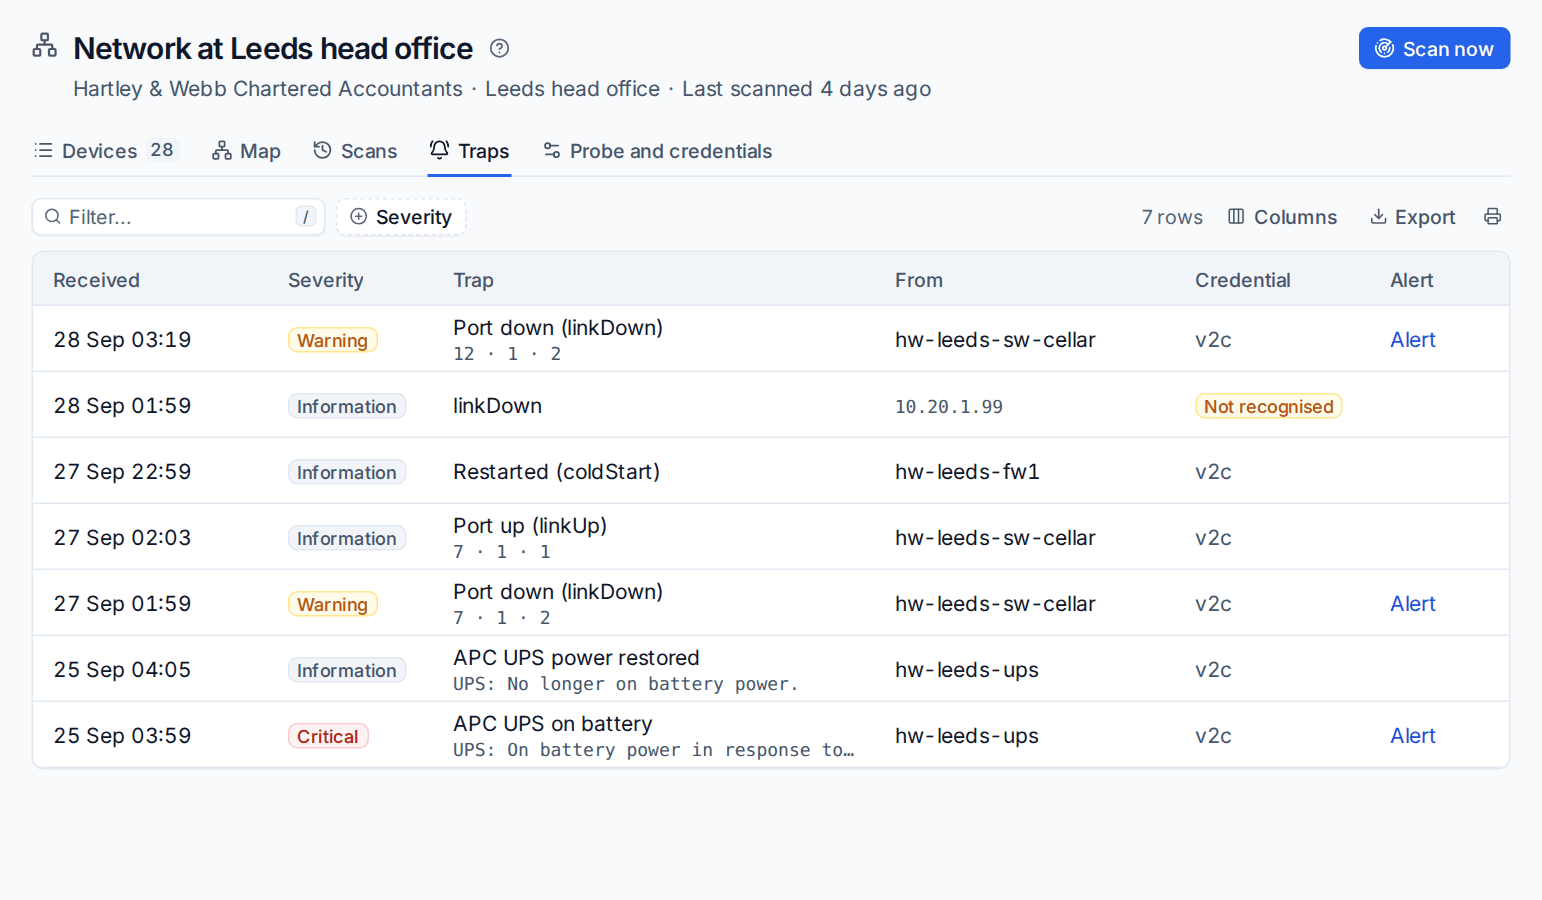
The Traps tab on the site's network page, and each device's page, list the traps received with their severity, what they were, where they came from, the credential, and a link to the alert they raised.
Trap rules
Settings > Network > Trap rules says what each trap means. Each rule matches a trap's OID (exactly, a family ending in .*, or anything) and either Alerts, Logs it or Ignores it.
- An alerting rule has a severity and a title, which can include the device, the port and values from the trap.
- Cleared by names the trap that closes the alert again, so a Port down (linkDown) alert closes when Port up (linkUp) arrives, and APC UPS on battery closes when power is restored.
- 13 rules come built in, covering ports, restarts, authentication failures and UPS events. They can be changed and reset.
- Your own rules are checked before the built-in ones, so a new rule takes effect without reordering.
Under Settings > Network > SNMP traps you can turn trap receiving off, change the Trap port and set how long traps are kept.
Trap alerts are Monitoring alerts, so your alert rules route them to tickets and notifications. See Alerts into tickets and notifications.
Related
Was this page helpful?
Thanks for the feedback.