NAS monitoring without an agent on the NAS
Add a customer's TrueNAS with a read-only user, let an agent at the site read it, and watch its pools, scrubs, disks, tasks and the NAS's own alerts from one page.
A pool can say it is healthy while its disks return bad data, and a scrub can "finish" without reading anything. Tenvara reads a customer's TrueNAS over its own API, with a read-only user, through the agent on a computer at the same site. Nothing is installed on the NAS.
NAS monitoring is in both editions and needs the Monitoring module. It sits in Infrastructure > NAS and storage (the page heading is NAS), in the Servers and storage group.
Before you start: a read-only user on the NAS
On the TrueNAS:
- Go to Credentials > Users and add a user, for example
tenvara-monitor, with no home share. - Give it the Read-only Administrator role (through a group with that privilege).
- Open the account menu at the top right, then My API Keys, and add a key for that user.
Never use a full administrator: Tenvara only reads.
Adding a NAS
- Open Infrastructure > NAS and storage and click Add NAS.
- Choose the Customer and the Site where the NAS is. The agents at that site poll it.
- Choose TrueNAS as the Make, and give it a Name as it should appear in lists and alerts, for example "Office NAS".
- Enter its Address as the agent reaches it, and the Port (HTTPS). Leave Check its certificate off for the self-signed certificate most units have.
- Under Read-only user, choose Type it (kept in the vault) or Choose from the vault. With An API key, enter the User and the API key. Typed details are saved as a vault credential of the customer.
- Under Polled from, keep An agent at the site and choose Polled by: a computer at the site that is usually on and can reach the NAS.
- Keep Fail over to any agent at the site ticked, so the next online computer there takes over when the chosen one is offline or cannot reach the NAS, and hands it back when it returns.
- Choose Poll every (5 minutes by default). Health is read every poll; SMART detail and the task lists hourly.
- Click Add NAS.
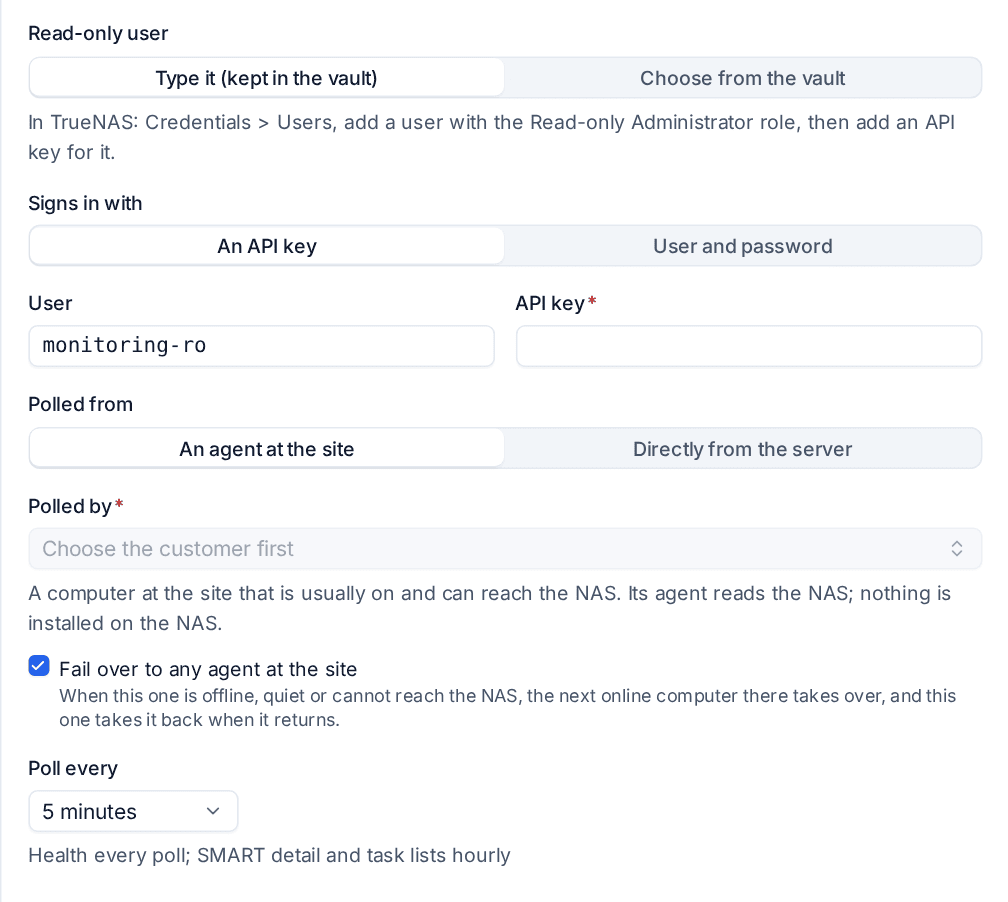
Test on the unit's page runs the check now and shows what was read and anything the user's rights refused.
Note: Directly from the server polls the NAS from the Tenvara server itself, which must then be able to reach it. The form warns that this is rarely wise: for a NAS on a customer's network, use an agent at the site.
A NAS the network scan found
When a site's network probe finds a NAS that is not monitored yet, the NAS page lists it with Add (the form filled in with its customer, site, name, address and make) and Ignore, so it is not offered again.
The NAS list
The list shows each unit's status, name, customer and make and model, with figures at the top for NAS units, Not answering, Pools not healthy and Disks that need a look. A customer's Devices tab and a site's devices also list their NAS units.
The unit's page
Open a unit to see its make, model and version, the customer and site, who polls it (with Failed over when another agent has taken over) and when it last answered. Test, Poll now and Edit are in the header. The tabs:
- Overview: open alerts with what to do, the NAS's details, Polling, and history graphs.
- Storage: each pool's state, layout and use, and its read, write and checksum errors in red even while the NAS calls the pool healthy, with any damaged data the pool could not repair. The last scrub shows when it ran, how long it took and what it found, marked Impossibly fast when it could not have read the pool's data in that time.
- Disks: every disk in slot order with its model, serial, size, pool, temperature against its limit and SMART status.
- Tasks and UPS: replication, snapshot and cloud sync tasks, failed first, with their last result and next run, and the UPS.
- Alerts: the open alerts and the NAS's own alerts.
- Change log: pools, disks, tasks and the UPS added, removed or changing state.
NAS alerts
Alerts come through Alerts and your alert rules like any other. Each says since when, why, and what to do in the NAS's own menus.
| Alert | Raised when |
|---|---|
| NAS not reachable | Every agent that could poll it has tried and none got an answer (critical) |
| Pool | It is not healthy, worded by its layout and how many more disk failures it can take; it has read, write or checksum errors while it says healthy; or it has permanent data errors |
| Scrub | No scrub finished within the NAS's schedule plus a grace, or the last one was impossibly fast |
| Disk | The NAS or SMART calls it failing, it has pending or uncorrectable sectors, or its reallocated sectors are rising |
| Temperature | A disk is over its limit (critical) or close to it |
| Task | A replication, snapshot or cloud sync task failed, or stopped running on schedule |
| UPS | The UPS is on battery, low or out of contact |
| The NAS's own alerts | Passed through from warnings up, by default |
| Update available | The NAS offers an update (information) |
Checksum errors on every disk at once with healthy SMART point to something the disks share (memory, controller or cabling), and the alert says so. Every alert clears at the first poll that reads its part and no longer finds the problem.
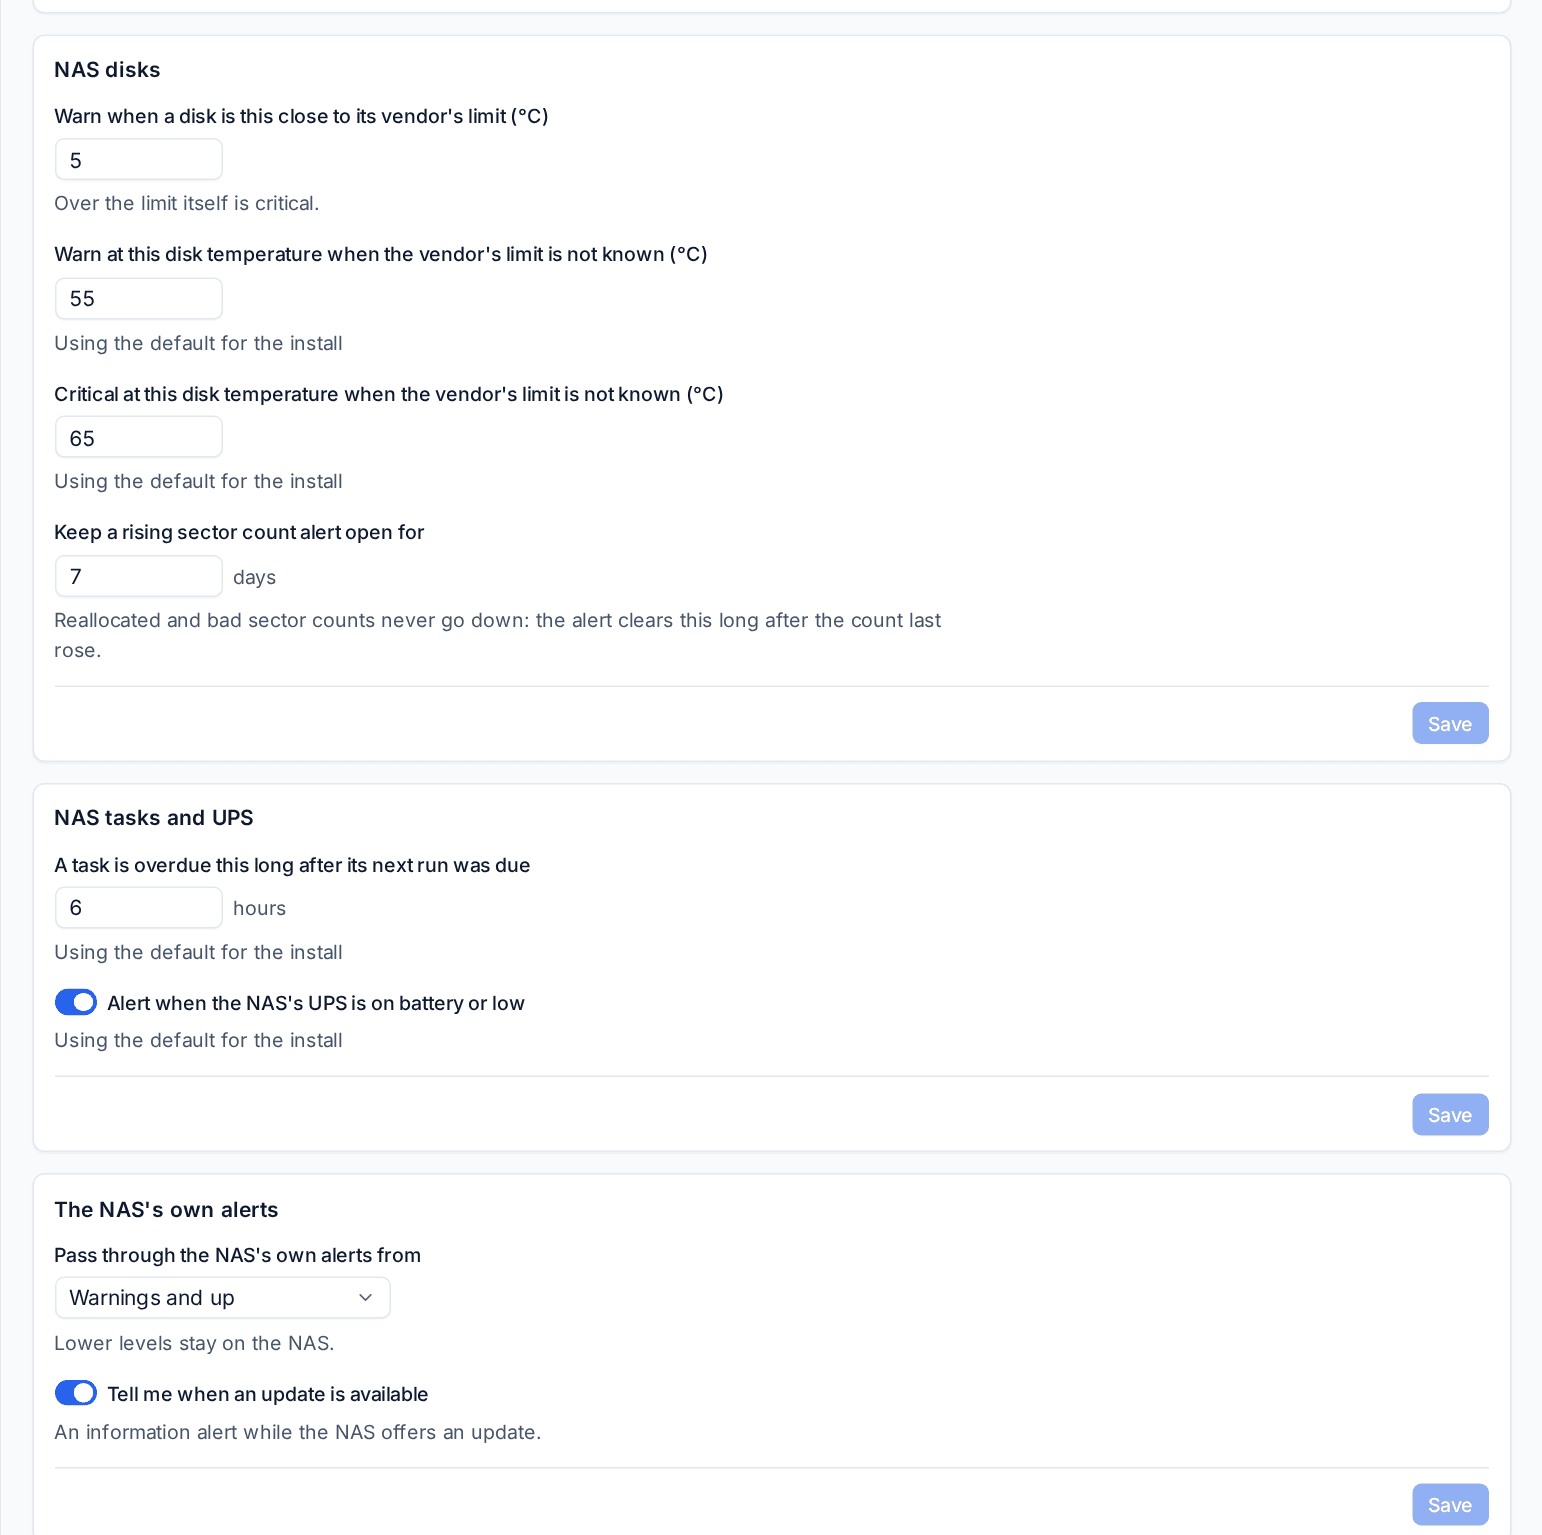
Changing the thresholds
In Settings > Monitoring:
- NAS disks: how close to its limit a disk may run, the temperatures to use when the limit is not known (55 and 65 °C by default), and how long a rising sector count keeps its alert open.
- NAS tasks and UPS: when a task counts as overdue, and whether the UPS alerts.
- The NAS's own alerts: which of the NAS's levels come through, and whether you are told about updates.
- Pool scrubs: how often a scrub is expected when the NAS has no schedule, the grace, and the speed above which a scrub is impossibly fast. The same rules judge the ZFS pools of Proxmox nodes.
Every field can be set differently for one customer.
Related guides
Was this page helpful?
Thanks for the feedback.