Forecast and sales reports
Read the forecast with commit, best case and pipeline, make the manager's call on each deal against company, team and personal targets, see where deals stall, and run the Monday sales meeting from one dashboard and the report builder.
The forecast tells you what the open pipeline should bring in. Each deal sits in a forecast category, a sales manager makes the call on the deals that matter, and progress shows against the company's, each team's and each salesperson's targets. Conversion shows where deals stall and which sources bring in the revenue, and a ready-made dashboard runs the weekly sales meeting.
Open Sales and billing > Opportunities and choose the Forecast tab. Forecast, Win and loss and Conversion at the top switch between the three views; choose 3 months, 6 months or 12 months, a pipeline and a person.
Note: The forecast, sales reports and the sales dashboard are part of the CRM, in the MSP edition. When salespeople see only their own deals (Who sees which deals in Settings > Sales), they see only their own figures here too.
The forecast
- Open pipeline, Weighted (each deal's value times its chance of winning), New monthly revenue, weighted and This month.
- By month: the weighted value expected to close each month, and what was won. Deals past their close date are counted in this month and called out.
- Forecast by owner and Forecast by stage.
- New business and renewals side by side: deals in the Renewals pipeline are shown apart, and new monthly revenue leaves them out. See Opportunities and pipelines.
- Service mix: for deals valued from a rough service mix, the seats and the weighted managed monthly, project and hardware values in the months shown.
Commit, best case and pipeline
Each open deal is in a forecast category:
| Category | Means |
|---|---|
| Commit | Will close |
| Best case | Could close |
| Pipeline | In play |
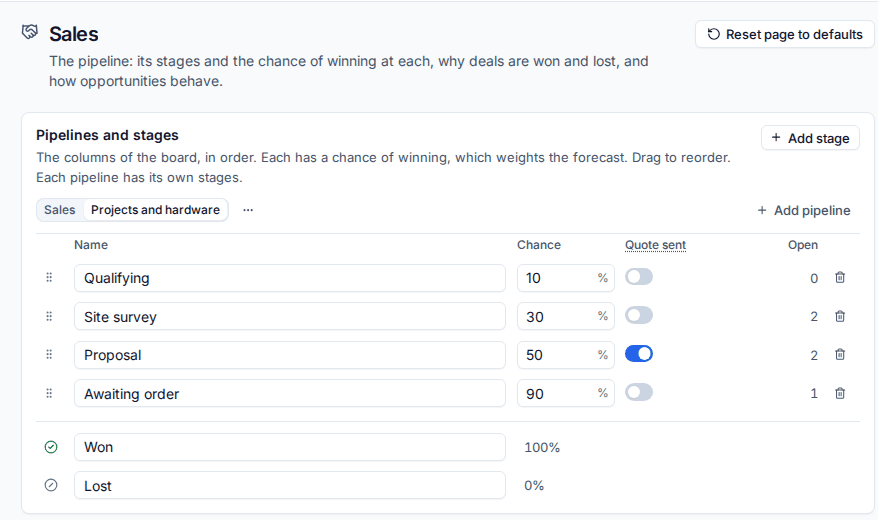
A deal takes its stage's category, set in Settings > Sales under Pipelines and stages, in the Forecast column. A stage without its own goes by its chance: 75% and up is commit, 40% and up best case, the rest pipeline.
The Forecast categories card shows Open opportunities by forecast category: commit, then commit and best case together, then everything open. A sales manager (an administrator, anyone with Manage sales settings, or the lead of a Sales or Accounts team) can make the Manager's call on any deal, moving it to another category. The deal keeps who made the call and when, and its timeline says so. Choose its stage's category again to undo it.
Targets
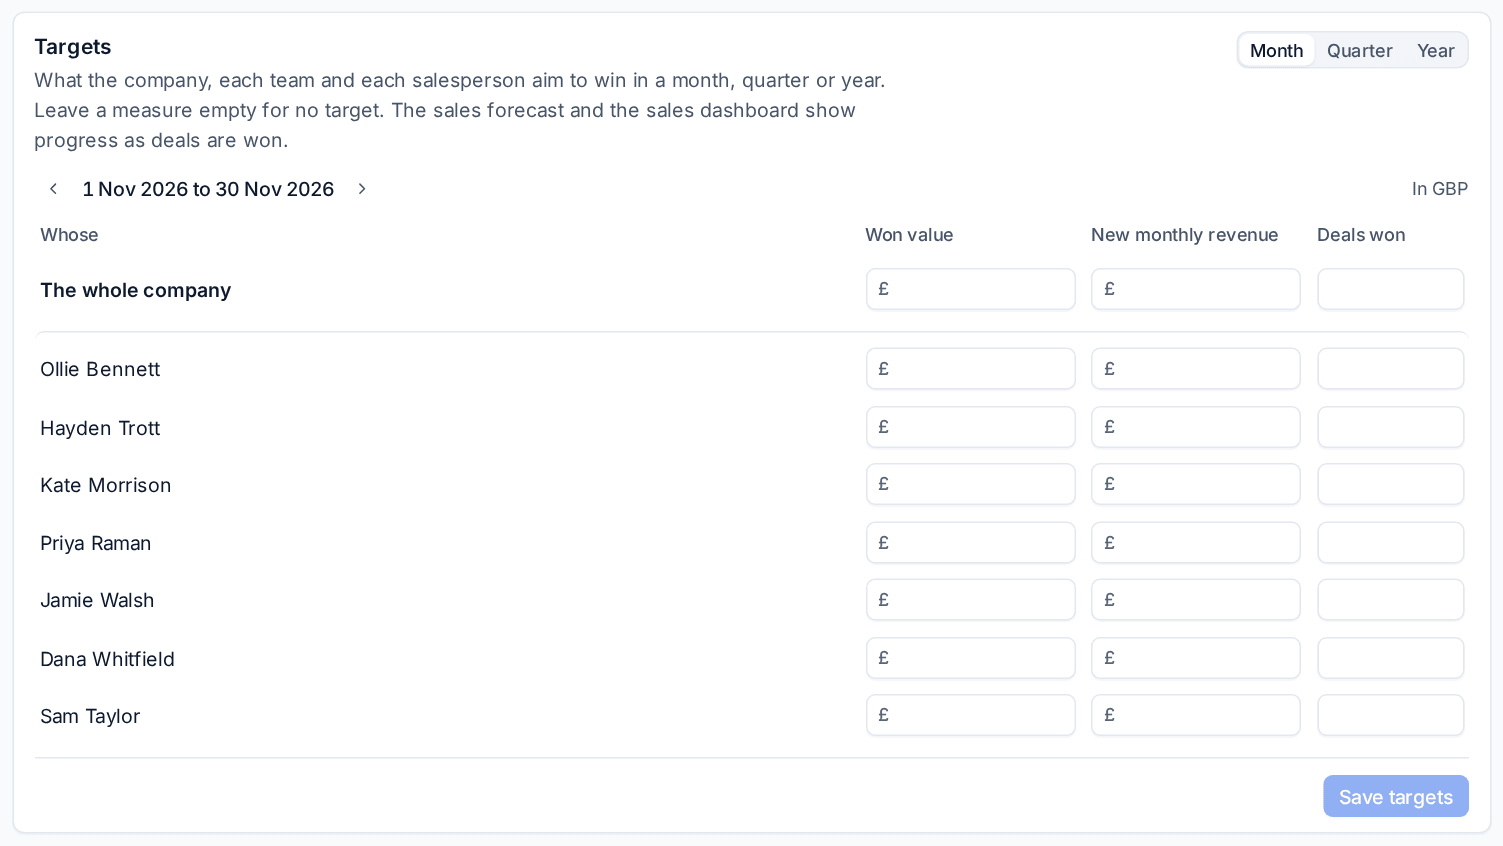
The Targets card shows progress this Month, Quarter or Year against the targets for won value, new monthly revenue and deals won: the whole company's first, then each team's, then each salesperson's.
Set them in Settings > Sales, under Targets: choose the period, then fill in The whole company, each Sales and Accounts team and each person. Leave a measure empty for no target. Values are in your base currency.
Win and loss
Win and loss covers a period: opportunities added, won and lost, the win rate, the average won deal and the days to close, by reason, source, owner and the competitors you lost to.
Conversion
Conversion follows the opportunities added in a period through one pipeline:
- Stage to stage: for each stage, how many reached it, Went on past it, were Lost here, are Still here, and were Won in the end. The page says which stage lets the fewest through and where deals stay longest.
- Time at stage: the average and median time deals spent at each stage, and how long the deals there now have been there. Time to win is from added to won, on average.
- Lead source to won MRR: the leads added from each source, how many Became customers, the deals from them, and the monthly recurring revenue and value won so far.
Every stage a deal enters is recorded as it happens, so conversion and time at stage stay right even when a deal skips a stage.
The sales meeting dashboard
Set up the sales dashboard on the forecast makes a shared Sales meeting dashboard, once, for a sales manager to run the weekly meeting from. It holds:
- new monthly revenue won this month against target;
- deals won this month, the weighted pipeline and how many deals are going cold;
- the pipeline by stage and the forecast by category;
- the deals going cold, and activity per person.
After that the button opens it. Change it like any dashboard: any figure can be measured against a sales target. A salesperson who sees only their own deals is measured against their own target.
Sales data in the report builder
The report builder has sales data and ready-made sales reports: Leads, Opportunities, Open pipeline (with days at stage, days since anything was done and going cold), Opportunities won and lost (with new monthly revenue won, reason, competitor and days to close), Opportunity stage history and Sales activities. Lead and opportunity custom fields are columns too. Each report shows only what the person running it may see, and money is in your base currency at today's rates. See The report builder.
Tip: Run the Monday meeting from the dashboard, then open the forecast and make the manager's call on anything closing this month. The figures the team sees follow your call at once.
Related: Opportunities and pipelines, Commission.
Was this page helpful?
Thanks for the feedback.