Script, file and server checks
Monitor anything with a script check, watch files, folders and installed software, check websites and VPNs from Tenvara itself, and find what is filling a disk.
Beyond services, processes, pings, ports, websites and event logs, a monitoring policy can run your own scripts as checks, watch files and folders, and check that software is installed. Tenvara can also check websites, firewalls and mail servers itself, with no agent involved. This guide covers those, plus the extra limits on ping checks, the disk forecast, stopped services and the disk usage breakdown.
Add any of these checks from a policy in Settings > Monitoring with Add check, or for one device from its Monitoring card. See Policies, checks and thresholds.
Script checks
A script check runs a published script from your library on every device the policy reaches, as system, and reads the result the way monitoring plugins do:
| Exit code | Result |
|---|---|
| 0 | OK |
| 1 | Warning |
| 2 | Critical |
| Anything else, or the timeout | The script could not check |
The first line the script prints is the result shown on the check. A script can also send numbers back, in the metric line format the Add a check dialog shows; each becomes a custom metric that is charted and that thresholds can alert on, like CPU or memory.
- Publish the script in the library first. Only published scripts can be checks, and every required parameter needs a default, because nobody is asked when it runs.
- In the policy, click Add check and choose Script as the Type.
- Give it a Name, choose the Published script and set the Timeout (seconds) (60 by default).
- Optionally name the metric to chart as the check's value.
- Set Run every (at least 5 minutes) and click Add check.
The check runs the version published now. When you publish a new version, every device picks it up within a minute; unpublishing or archiving the script stops the check with a reason.
Note: Adding or changing a script check needs the Scripts manage permission as well as Monitoring manage, because it runs code on every device the policy reaches. Each device only runs a script signed for that device and that check, and refuses anything changed on the way.
File, folder and software checks
| Type | Use it for | Settings |
|---|---|---|
| File | "The nightly backup file was written in the last 26 hours" | Full path (a * in the file name matches the newest file), alert when the file is missing or exists, older than (minutes), larger than (MB). Its value on charts is the file's age. |
| Folder | "The scans folder is under 50 GB", "The queue folder holds fewer than 500 files" | Full path of the folder, a total size limit, a file count limit, Include subfolders. |
| Software | "Antivirus is installed", "TeamViewer is not" | Application name (or part of it), alert when it is missing or installed, and Also alert when the version is below. |
Paths must be full paths (C:\..., \\server\share\... or /...). Folder checks never follow links or junctions and stop after a minute on very large folders.
Ping loss, round trip and jitter
A ping check records packet loss, round trip and jitter, and you can alert on each over time rather than on one bad reply:
- Alert when packet loss is at least (%), For (minutes): 50% for 2 minutes by default.
- Alert when the round trip is over (ms), For (minutes): 200 ms for 5 minutes by default.
- Alert when jitter is over (ms, empty for no limit), For (minutes).
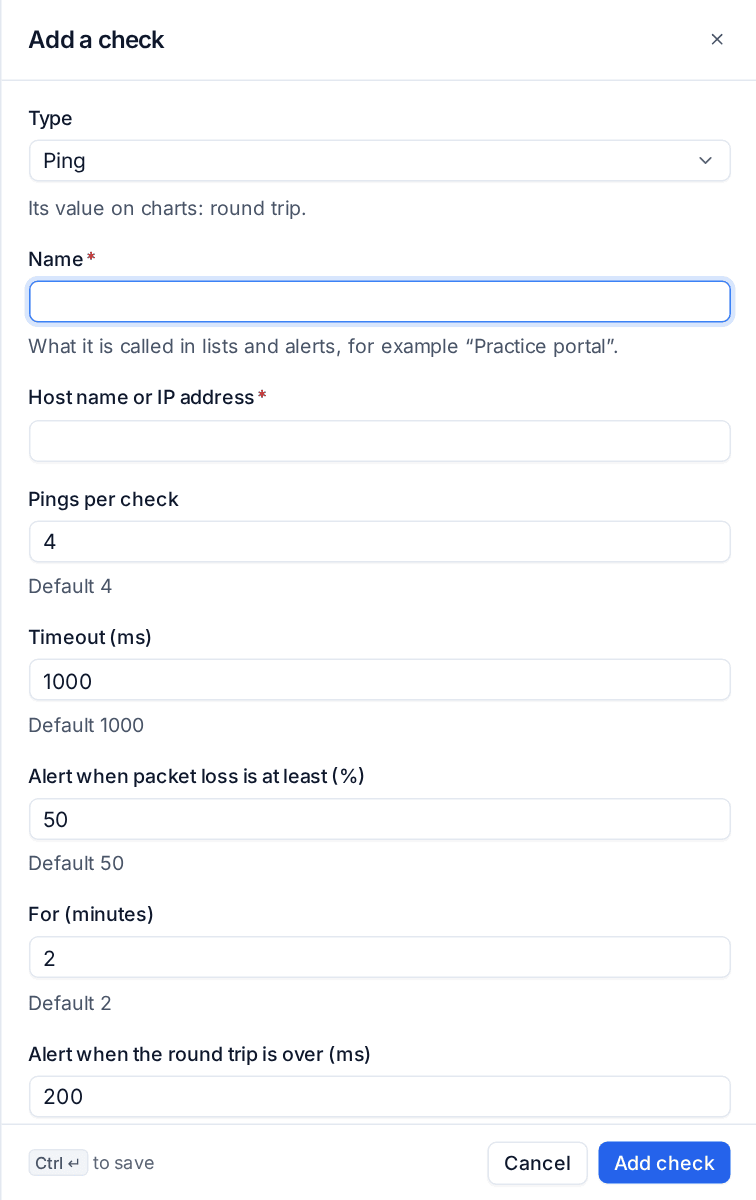
The check's history charts loss and jitter with the limits drawn on.
Stopped services and the disk forecast
Two thresholds help catch problems no single check names:
- Any automatic service that is stopped: a service threshold that watches every service set to start automatically, with a list of services to leave out (
*wildcards allowed). Services that only start on a trigger are never counted. The global default has one at info severity after 15 minutes, switched off until you turn it on. - A disk will be full within days: worked out from each volume's trend over the last 14 days. The global default warns 14 days ahead, one alert per volume, and clears when the forecast moves past the limit.
Checks from the server
Devices > Checks from the server checks a customer's website, public firewall address, VPN endpoint, mail server or hosted app every 1 to 15 minutes, from Tenvara itself or from an agent at the site.
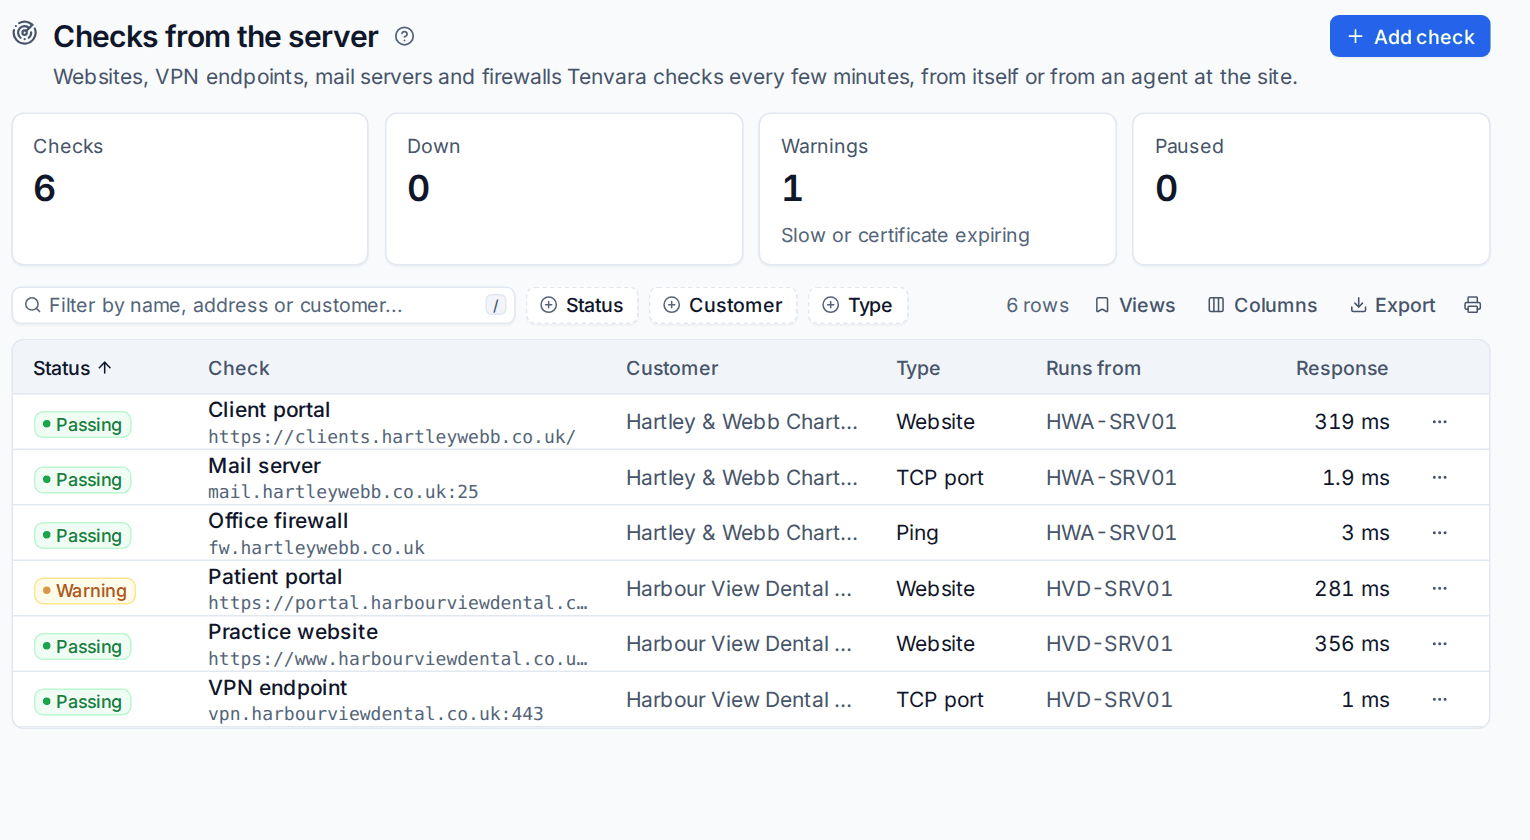
- Click Add check and choose the Customer, and optionally the Site and the Device it is about, such as the firewall (its alerts then go on that device).
- Under What to check, choose Website, Ping or TCP port, and give it a Name and an Address.
- For a website, optionally set The page contains, The page does not contain, Expected status codes and Check the certificate is valid.
- Under Run from, choose The server or An agent at the site. From the server, only public internet addresses are allowed; for anything on the customer's own network, run it from an agent there.
- Choose Check every, the failures before a warning and a critical alert, Slow after (ms) and the certificate warning and critical days, then click Add check.
Failures in a row raise a warning and then a critical alert (after 2 and 3 by default), a slow answer warns, and a certificate close to expiry warns or is critical. Each check keeps its response time history, with uptime over 24 hours and 30 days, and its certificates appear in the monthly customer report.
What's using the space
When a disk fills up, find out why without remoting in. On a device page, click What's using the space under a disk, or open it from a disk space or disk forecast alert.
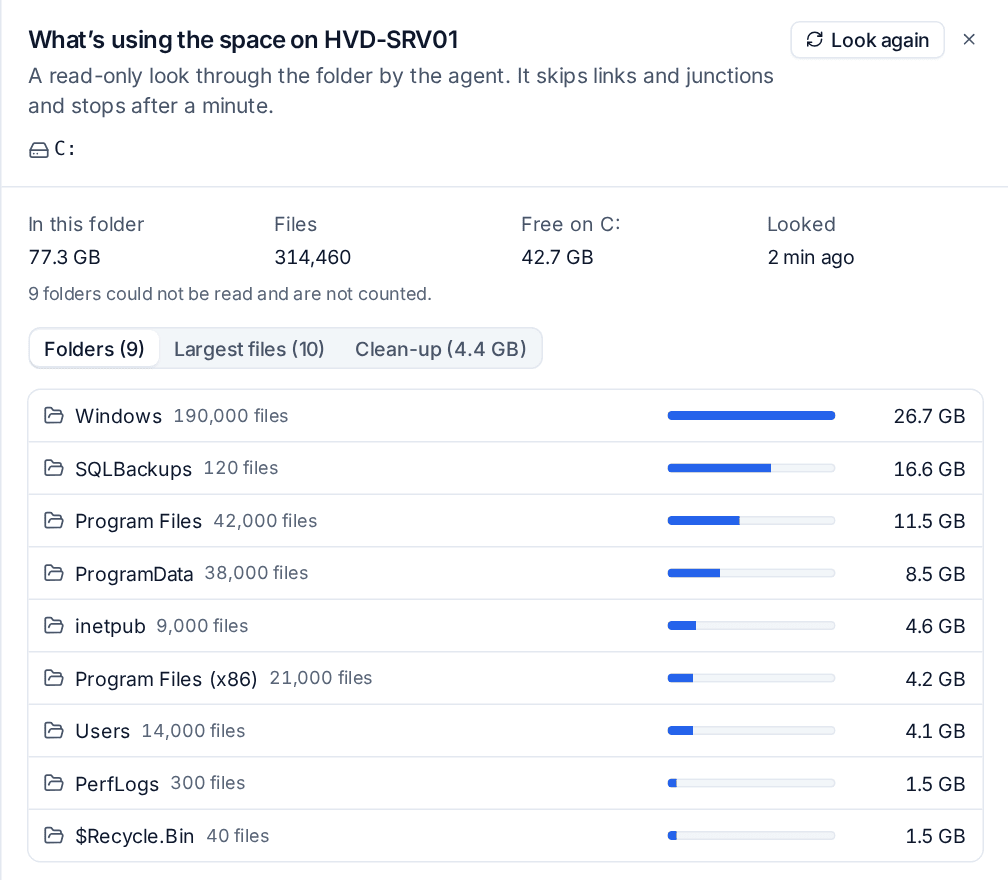
The agent takes a read-only look through the volume (skipping links and junctions, for up to a minute) and shows:
- Folders: the size and file count of each folder. Click one to look inside it.
- Largest files anywhere under it.
- Clean-up: known candidates such as the Windows Update cache,
Windows.old, temporary folders, recycle bins, users' Downloads and browser caches, with their sizes. One click opens Run script with a clean-up script and this device chosen.
A look from the last hour is shown at once, with Look again to refresh it. Nothing on the device changes, so it works on protected devices too.
Related
Was this page helpful?
Thanks for the feedback.