System status
How Tenvara itself is doing: the health checks, the five queue lanes and what holds them up, the install profile and sizing table, the upgrade clean-up, who is told when a part stops, monitors outside the install, the support bundle and the defaults for device diagnostics.
Settings > System status shows how Tenvara itself is doing, who hears when it is not, and what device diagnostics look for. It is for administrators. You can also open it from the account menu (your initials, top right) under Help > System status, or with Ctrl K or Cmd K.
The page has three tabs: System health, Support bundle and Device diagnostics. On a hosted instance we watch the install for you, and the page shows what we see.
System health
One line at the top sums up the whole install: its state, when it was last checked and which checks are not healthy. Check now runs every check straight away, and Thresholds and alerts opens the settings for them.
Below it, System status lists every part of Tenvara, checked every minute. Each line shows its state (healthy, Worth a look, Problem or Not checked), what was measured, since when it has been in that state, and for a problem, when people were told and when the next reminder goes.
| Check | What it looks at |
|---|---|
| Scheduler | How long since the scheduled work last ran |
| Worker | Whether queued work is being picked up, and what each lane is busy with |
| Queue | How many jobs wait, how long the oldest has waited, and what is holding it up |
| Failed jobs | Jobs that failed in the last day, with the reason |
| Database | Its size and how quickly it answers |
| Disk | Free space where Tenvara keeps its files |
| Certificates | Days left on the certificate of your Tenvara address and any other hosts you list |
| Core, remote and backup services | Whether each answers, how quickly, and the version it runs |
| Backup service memory | The memory the backup service has, and how many Microsoft 365 tenants it backs up at once, with the value to set when it is short |
| Microsoft 365 backups | Whether every protected tenant has a backup |
| Backup repository indexes | Whether each backup repository's index is in good order, with a link to Backup > Repositories when one needs attention |
| Integration workers | How many workers the Microsoft 365 and other syncs need for the tenants you have connected, and whether the server can run enough of them. The workers for integrations grow with the number of connected tenants |
| Office previews (converter) | Whether the converter that shows Word, Excel and PowerPoint files is set up and answering, and if previews are off, exactly why and what to change |
| Email security reports | Whether report mail for your customers' domains arrives, when email security reports are switched on |
| Monitoring history, queue and cache | Whether the stores behind monitoring, security events, the queue and the cache answer |
| Security event pipeline | When the last security event arrived, while Security is on |
| Live updates | Whether the live update server accepts connections |
| Agent release on offer | The newest stable agent that devices are offered |
| Microsoft 365 app registration | Whether your app registration has the redirect address and the permissions Tenvara needs, when Microsoft 365 is connected |
A module you have switched on whose service is not there shows as a problem too, so a part of Tenvara that is on but cannot work never goes unnoticed. A line that names the page where it is fixed links straight there.
Recent changes at the bottom of the page lists every change of state, newest first, so you can see when something started and when it cleared.
Tip: When the app registration check shows a problem, Settings > Microsoft 365, under App registration, lists each thing to fix. See Connecting a tenant.
Queues and what holds them up
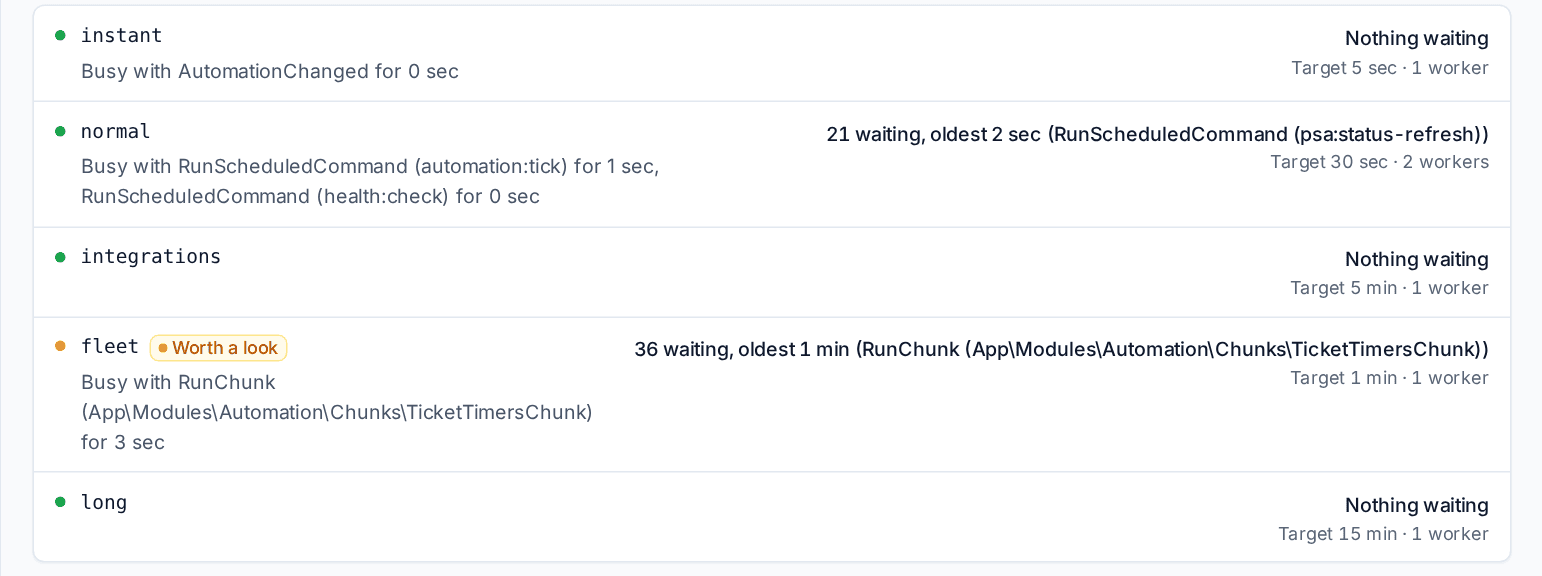
Tenvara does its background work on five lanes, so a long job never holds up email, live updates or alerts. Queue lanes shows each one:
| Lane | For | Target wait |
|---|---|---|
| instant | Live updates on records, notifications, sending email and chat | 5 seconds |
| normal | Tickets, alerts, automation, approvals and quick scheduled work | 30 seconds |
| integrations | Microsoft 365, accounting, distributor, calendar, DNS and other syncs | 5 minutes |
| fleet | Results from devices: monitoring, patching and security | 1 minute |
| long | Scans, exports, imports, reports and the nightly runs | 15 minutes |
Each lane has its own workers, which are added while its jobs wait and taken away when it is quiet. A lane's line says what it is busy with and for how long, how many jobs wait and which job is the oldest. A lane that has waited longer than its target, or a job that has run past its limit, shows Worth a look and raises an alert, so you hear about a blocked queue rather than finding it when email is late. Queue dashboard opens the queue's own dashboard with every job.
The install profile and sizing
A self-hosted install sizes itself for the server it runs on. The installer and every update pick a profile from the server's CPUs and memory, and the database, the event store, the queue workers and backups size themselves from it.
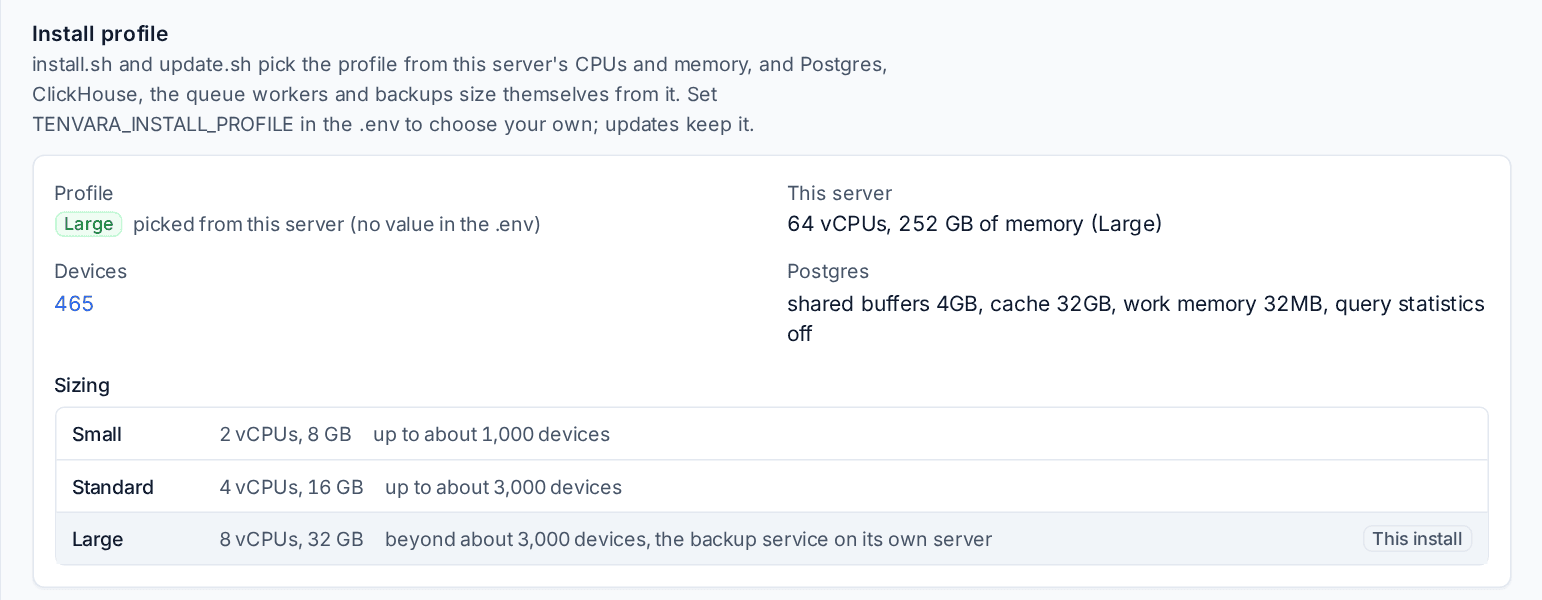
Install profile shows the profile in use and whether it was picked from the server or set by you, the server's CPUs and memory, how many devices the install looks after, and how the database is sized. The Sizing table marks your row:
| Profile | Server | Looks after |
|---|---|---|
| Small | 2 vCPUs, 8 GB | up to about 1,000 devices |
| Standard | 4 vCPUs, 16 GB | up to about 3,000 devices |
| Large | 8 vCPUs, 32 GB | beyond about 3,000 devices, with the backup service on its own server |
The section warns when the install looks after more devices than its profile is sized for, when a profile set by hand is larger than the server, and when the database is still on its stock settings. To choose a profile yourself, or to give the backup service more memory, see Install settings and profiles.
The upgrade clean-up
After an upgrade, Tenvara looks again at the open alerts and detections that were raised under its older noise rules. Upgrade clean-up, on the System health tab, shows what the last clean-up did: how many it closed (with the reason, without telling anyone, and closing their tickets without emailing customers), how many it lowered and how many it kept, by kind of alert. Preview shows what a clean-up would do now without changing anything, and Apply runs it.
Who is told
Problems are sent straight away, directly rather than through the queue, so they still go out when the queue is the problem. Each failing check is told once, reminded while it lasts, and told again when it clears.
The Alerts card shows Who is told (every administrator, plus any addresses you add), whether Text messages go too, When (problems only, or warnings as well) and how often Reminders repeat. Change who is told edits them, and Send a test sends to everyone who would be told. Thresholds and alerts sets the limits themselves (disk space, failed jobs, queue waits and so on) and the certificate hosts to watch.
Someone outside the install
A server that is completely down cannot tell anyone about it. Three things can notice from outside:
- External heartbeat: Tenvara pings a heartbeat address of yours every few minutes, and that service raises the alarm when the pings stop. Set up a heartbeat sets the address (Change the heartbeat once there is one), and Send now tries it.
- Watchdog: a small script for the Docker host's own schedule, which runs outside every container, checks Tenvara and its containers and emails, texts and pings by itself when they are not well. Make a token makes its token (shown once), and the page shows the cron line to add, with a copy button.
- Outside monitors: point an uptime monitor at the health address shown on the page, with the watchdog token. It answers 200 when all is well and 503 when something is wrong. Outside monitors see a failure when chooses which failures count.
Setup checks and health
The same tab sets how the setup helper's checks run: whether they run on their schedule, how soon a check may run again, how long before one is given up, and when Health calls a section half set up or a module unused. See Go-live and Health.
Support bundle
The Support bundle tab makes one ZIP for whoever supports your install.
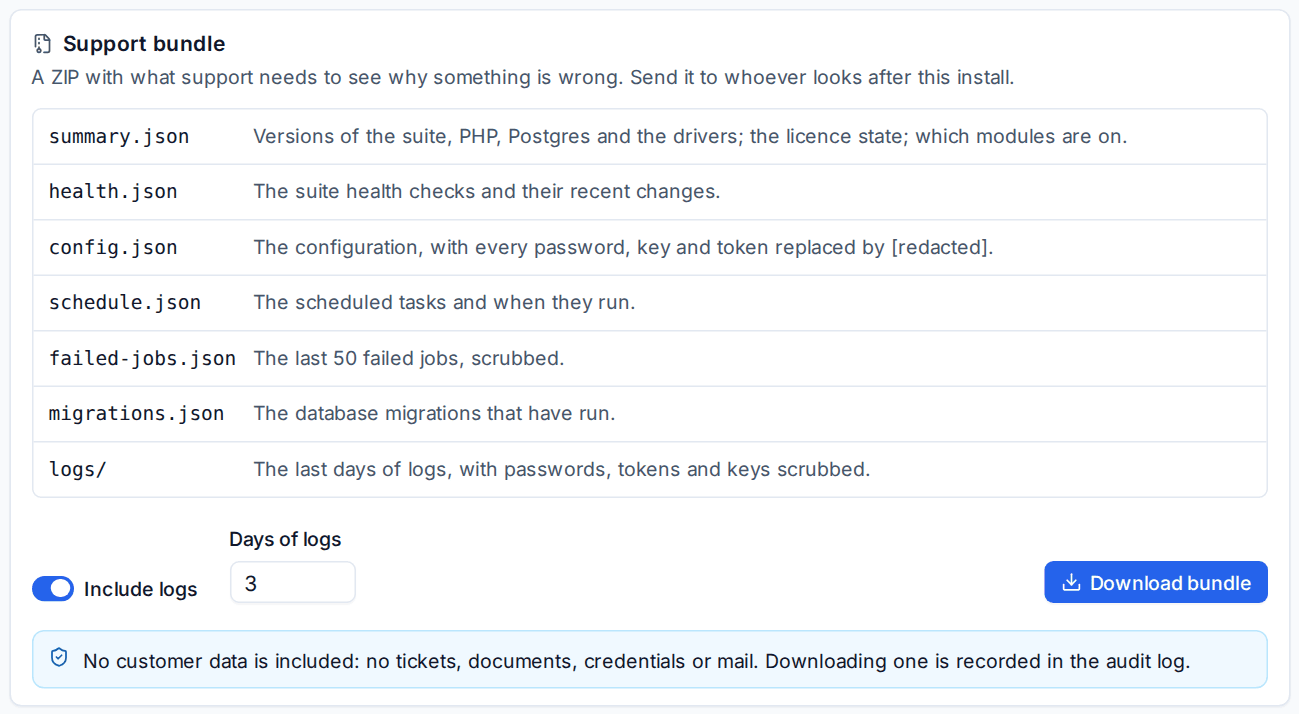
It holds versions, the licence state (never the licence itself), which modules are on, the health checks and their recent changes, the configuration with every password, key and token replaced by [redacted], the scheduled tasks, recent failed jobs and, with Include logs on, the last 1 to 14 days of logs with secrets scrubbed.
- Switch Include logs on if support asked for logs, and set Days of logs.
- Press Download bundle and send the file to whoever looks after your install.
No customer data goes in it: no tickets, documents, credentials or mail. Every download is recorded in the audit log. Help > Download a diagnostics bundle in the account menu makes the same file.
Device diagnostics
The Device diagnostics tab sets what the read-only diagnostics on a device look for.
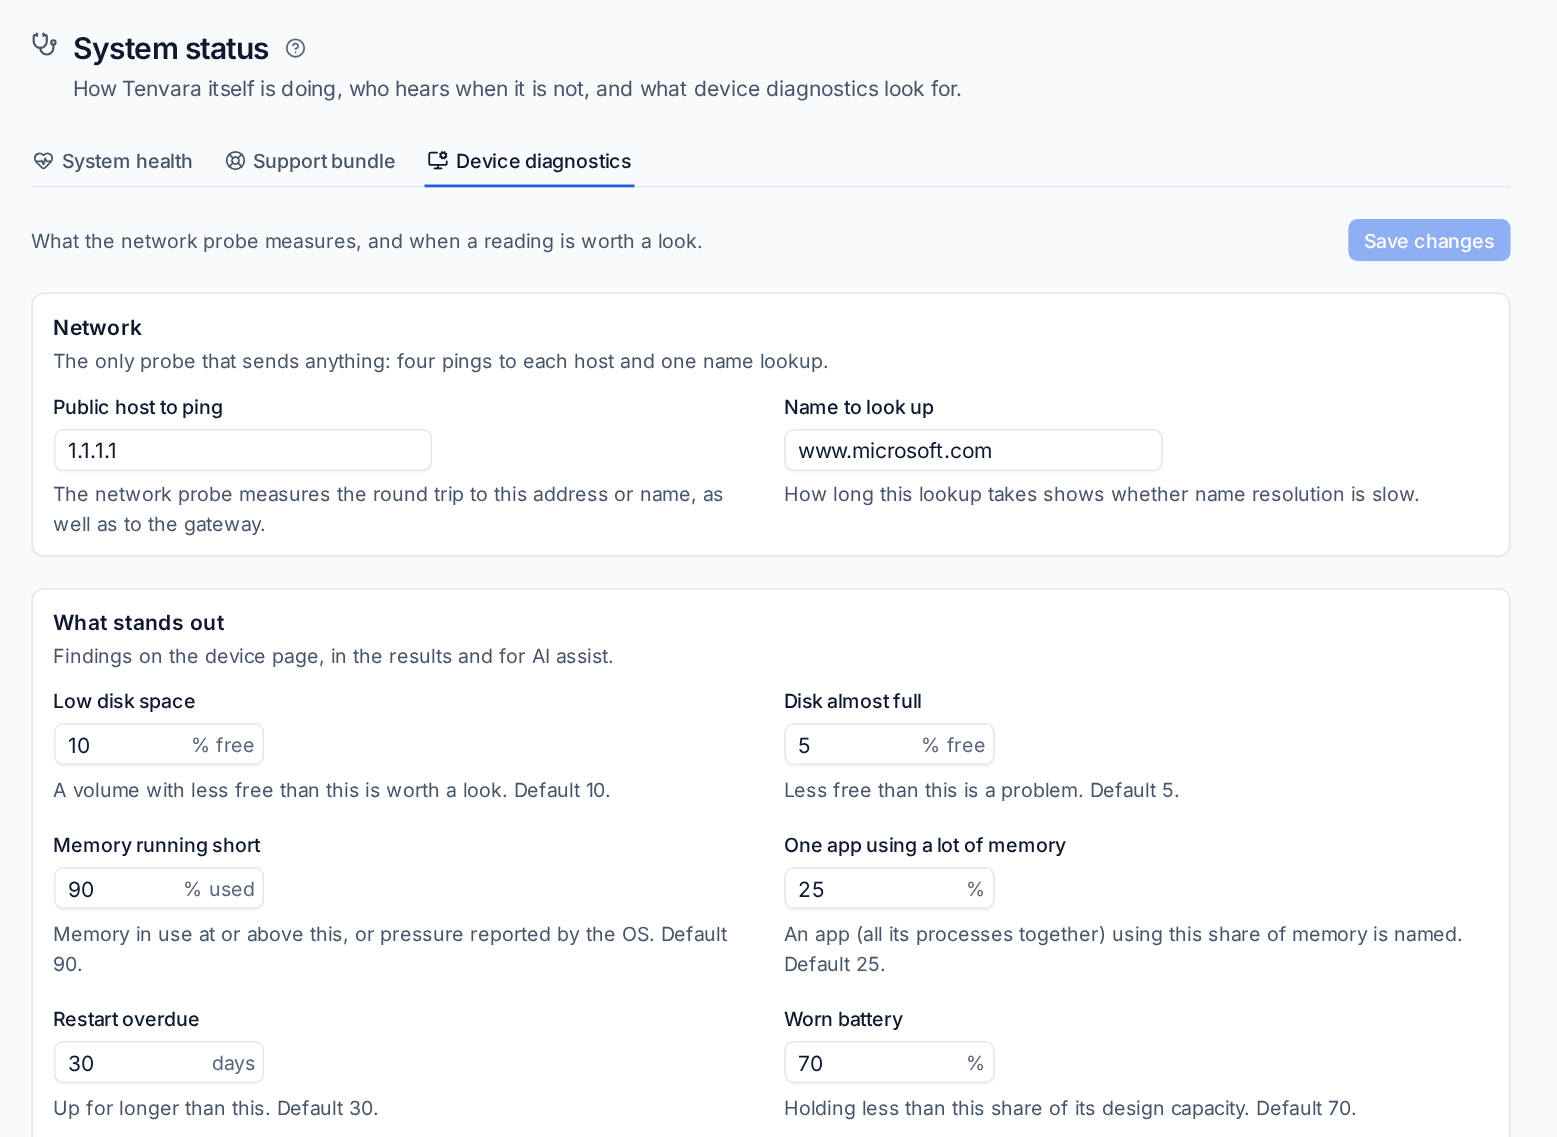
- Network: the public host the probe pings and the name it looks up.
- What stands out: when a disk counts as low or almost full, when memory is running short, how much memory one app may use before it is named, when a restart is overdue, when a battery counts as worn, and what counts as a slow round trip or a slow name lookup.
- Results count as current for: how long a recent run is reused instead of starting another.
These are the defaults for every device; the device page shows the results. See Diagnostics.
Related
Was this page helpful?
Thanks for the feedback.