The sync timeline and Microsoft throttling
See when each area of a tenant was last read from Microsoft, how long it took and how late it ran, which tenants cost the most to sync, why a queued area waits, and what happens when Microsoft throttles a tenant.
Tenvara reads each tenant in areas (directory, security settings, Exchange, sign-ins and the rest), each on its own interval. Most of the time you never need to think about it. When a customer asks why a change in their tenant has not shown yet, or a tenant always seems a little behind, the sync timeline answers it: when each area last ran, how long it took, how long it waited and why.
A tenant's sync timeline
- Go to Cloud > Tenants and open the tenant.
- Choose the Sync timeline tab (under More if it does not fit).
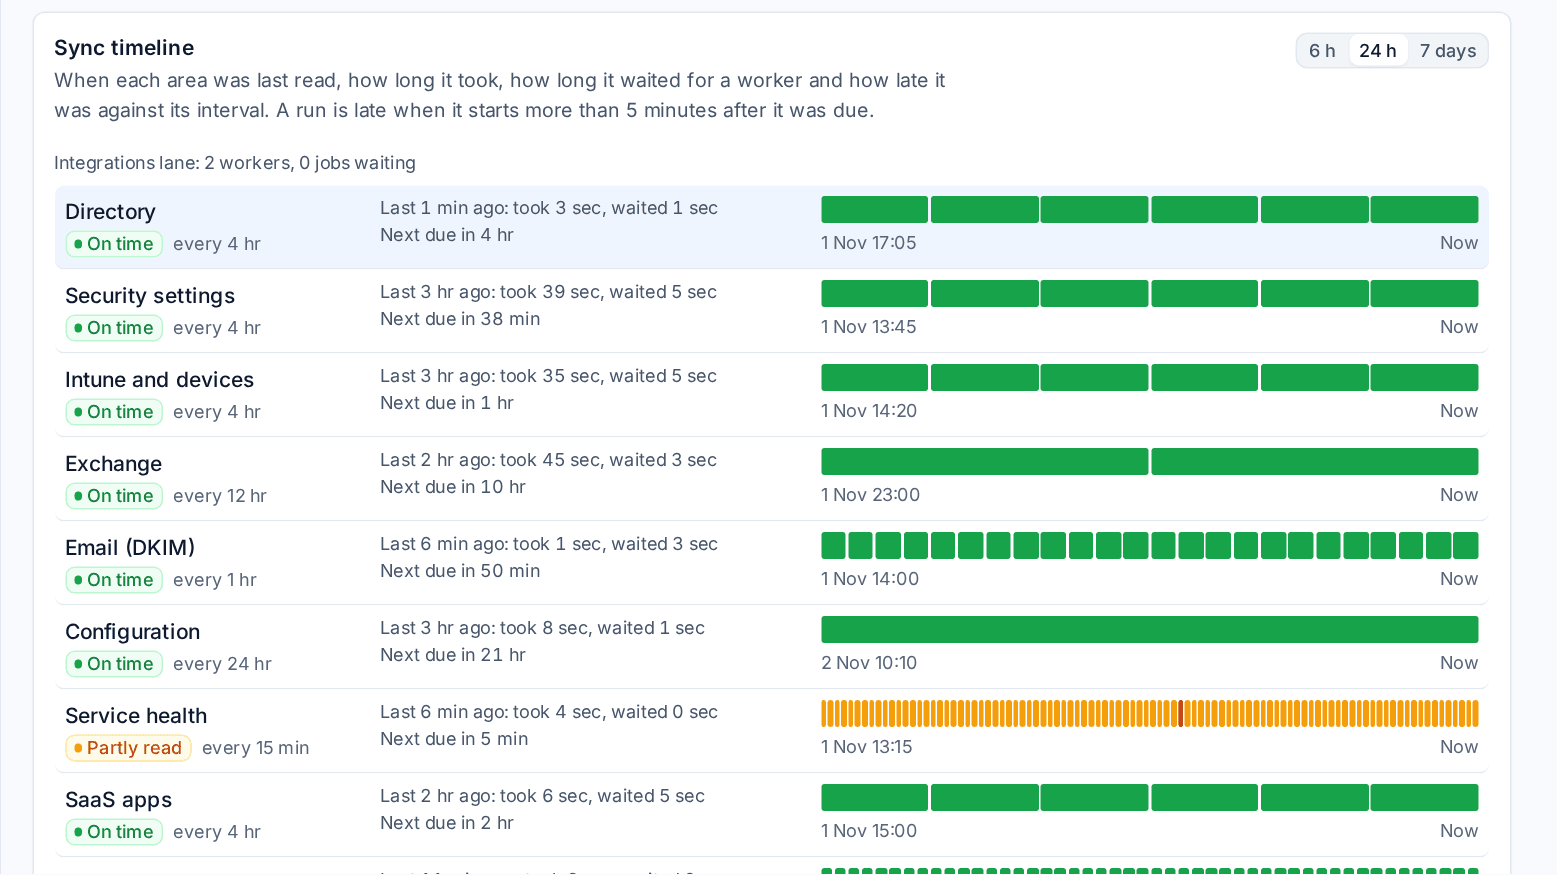
Choose the range with 6 h, 24 h or 7 days. Each area has one row:
- Its state, for example On time, Partly read (Microsoft would not give part of it), late, failed, running, queued or waiting for consent.
- Its interval, such as every 4 hr.
- The last run: how long ago, how long it took and how long it waited for a worker, and when it is next due.
- A strip of its runs across the range: green on time, amber late or partly read, red failed, blue still running.
A run is late when it starts more than 5 minutes (one scheduler tick) after it was due. Due is worked out from the area's previous run plus its interval, so an area is never called late for running at a different moment from last time.
Select an area (or move between areas with the arrow keys) to list its runs underneath: when it was due, the result, how long it waited and took, how late it was, the batches and calls it made, how many times it waited for Microsoft, the worker time, and why it waited or the error.
The line above the areas says how the integrations lane is doing, for example "Integrations lane: 2 workers, 0 jobs waiting".
Why an area waits
A queued area always says why, in this order:
- Microsoft is throttling the tenant, until a time Microsoft gave.
- Microsoft asked for a pause, and the area runs again at a set time.
- The tenant's own other areas are running: one tenant only takes its share of the workers, so a big tenant cannot hold up everyone else.
- Jobs ahead of it, grouped by tenant, for example "Waiting behind 4 jobs: Directory, Exchange and Intune and devices of one tenant (2 running)".
Across every tenant
Cloud > Sync timeline shows the same across all your tenants (in the Company edition it shows once your organisation has more than one tenant).
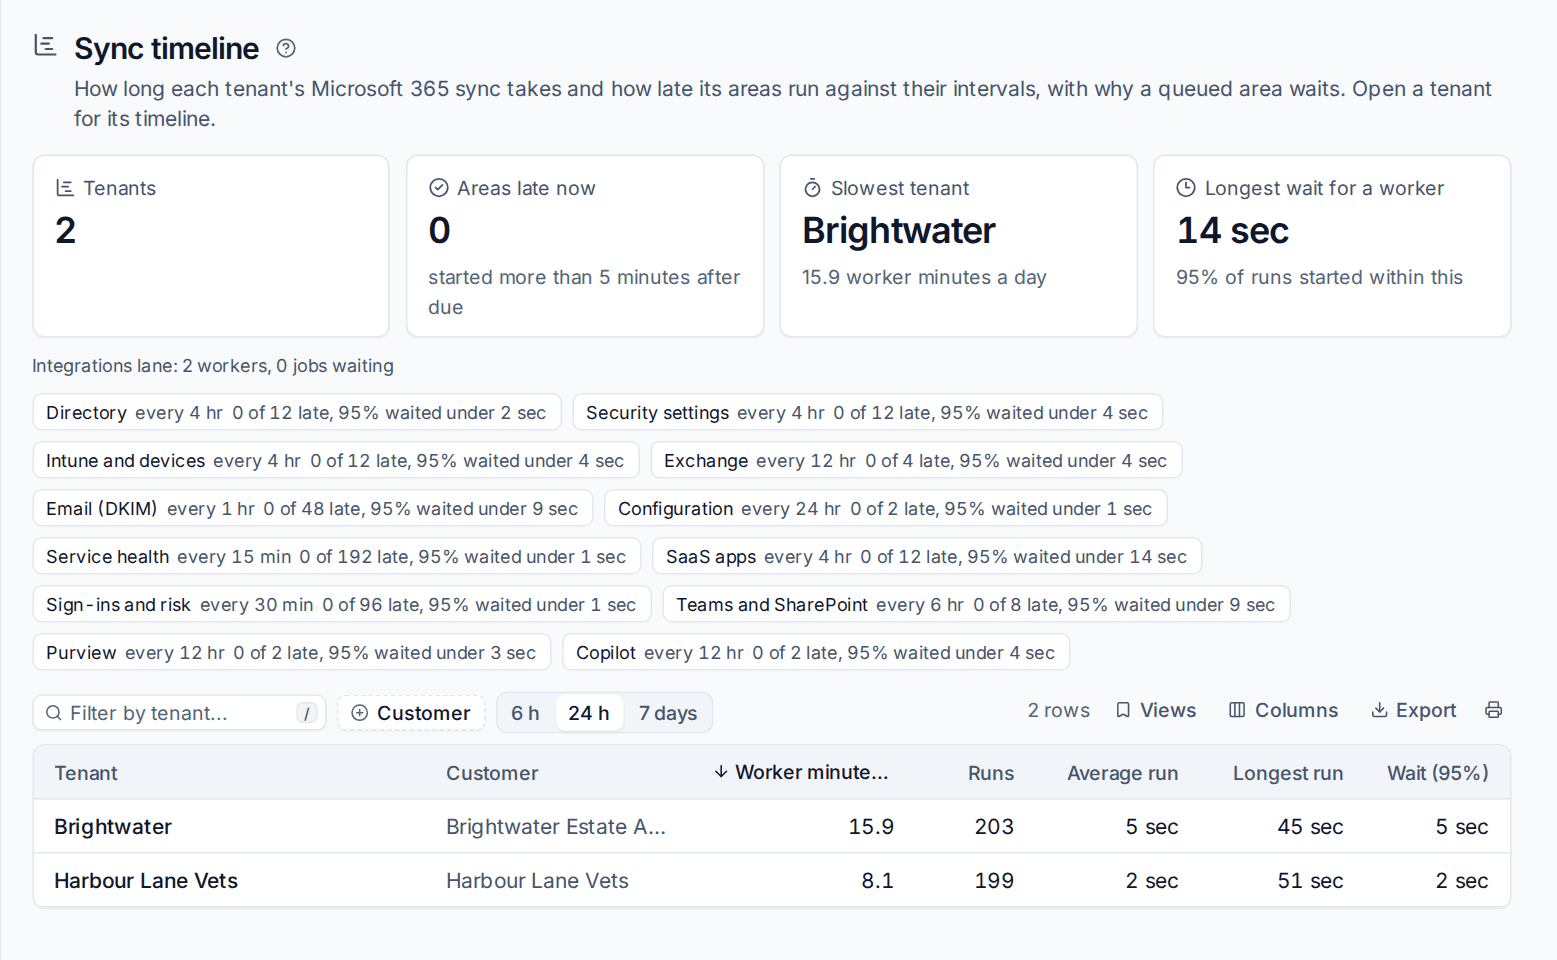
The top counts Tenants, Areas late now, the Slowest tenant (by worker minutes a day) and the Longest wait for a worker that 95% of runs started within. A chip per area sums it up, for example "Directory every 4 hr, 0 of 12 late, 95% waited under 2 sec".
Two tabs list the detail:
- Slowest tenants: each tenant with its customer, worker minutes a day, runs, average and longest run and the 95% wait, sortable by any column. A tenant at the top costs the most to keep in sync, usually because it is big.
- Areas running late: each tenant and area that is late now or was late in the range, the latest first, with Why. "Every area is on time" when there is nothing to show.
Filter by tenant or customer and choose 6 h, 24 h or 7 days. Click a tenant to open its own timeline.
When Microsoft throttles a tenant
Microsoft limits how much each app may ask of each tenant (and of every tenant together), separately for Graph, Intune, Exchange, SharePoint, compliance and Teams. Tenvara keeps count of what it asks and paces itself to stay under those limits. If Microsoft still says "slow down" for a tenant:
- Only that service for that tenant pauses, until the time Microsoft gave. Intune throttled leaves the directory reading, and other tenants carry on as normal.
- The tenant list, the tenant page and the customer's Microsoft 365 tab say "Microsoft is throttling this tenant until" that time.
- The waiting areas give their workers back to other tenants and pick up where they stopped. A throttled tenant catches up afterwards; it never fails because of the wait.
Something you ask for yourself, such as a change, still goes straight to Microsoft.
A step that fails part-way through an area is tried again from that step, not from the start of the area, so a retry does not read everything twice.
When the server needs more workers
The number of workers for Microsoft 365 grows with the number of tenants you connect, within what the server has. When the server cannot run as many as your tenants need, Settings > System status (the System health tab) says so in its Integration workers row, with the numbers, for example that your tenants need about three workers and the server can run two, so syncs may run late. On a self-hosted install, add CPU or memory to the server.
Related
- Tenants and the tenant page: the areas and their intervals, and the sync history on the Settings tab.
- Connecting a tenant
Was this page helpful?
Thanks for the feedback.