Alert storms and first-run findings
How an alert storm starts, what it holds back and when it ends, how alerts with one cause become one alert, and how the first run of a new check, a module, an import or a first sync becomes one findings report instead of a flood of alerts.
Two things can turn a quiet alert list into hundreds of alerts in a few minutes: something really going wrong at one customer, and Tenvara looking at something for the first time. Tenvara handles both so that you get one thing to look at rather than a page, a ticket and an email for each.
- An alert storm gathers a burst of alerts at one customer under one alert.
- One cause, one alert gathers the alerts that share one parent (a device, a tenant, a backup source, a host, a CVE) under one alert that lists them.
- A findings report gathers what a first run finds into one report with one notification.
Alert storms
When a storm starts
A storm starts when more than 20 alerts have told people about one customer within 10 minutes. The next alert opens an Alert storm alert for that customer and is held under it: one ticket and one page instead of many.
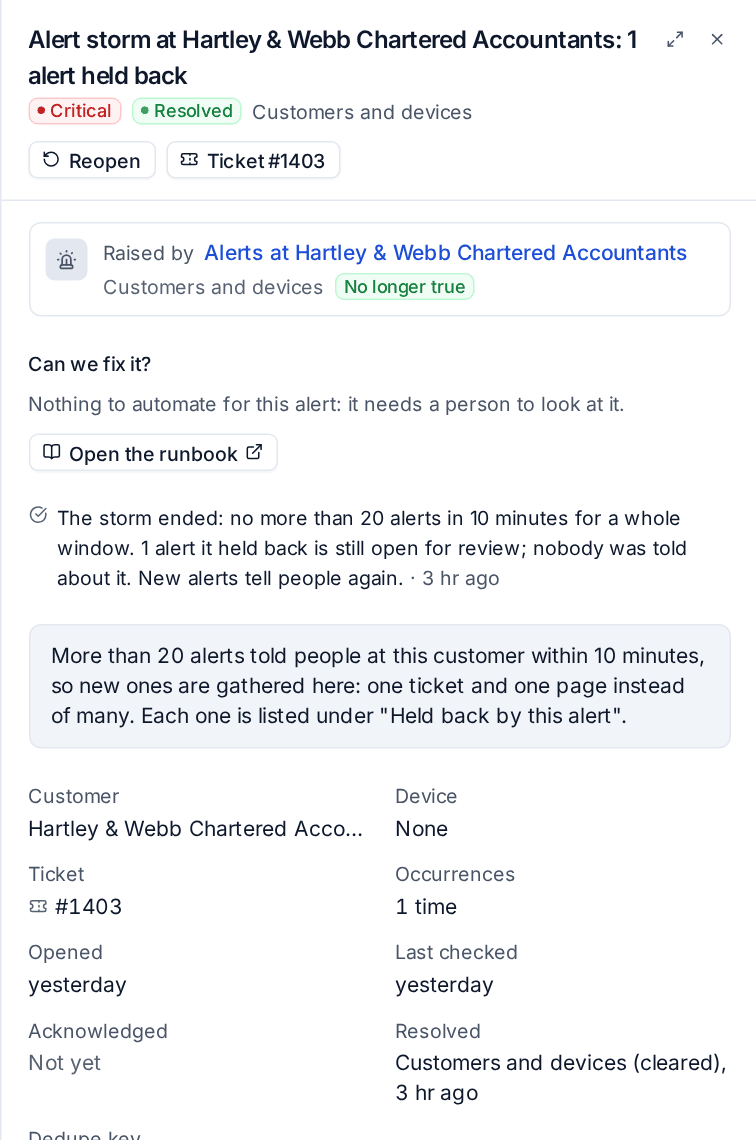
The storm alert is Raised by the customer's alerts, and each alert it holds is listed on it under Held back by this alert. In the alert list, those alerts are marked Held back.
What a storm holds
A storm holds alerts only while they keep arriving faster than the limit. While the storm is open, a new alert joins it only if at least 20 other alerts opened for the customer in the last 10 minutes. Once the rate drops below that, new alerts tell people at once, even though the storm alert is still open.
When a storm ends
A storm ends in one of two ways:
- By quiet: nothing has joined it for a whole window (10 minutes by default).
- At the maximum: two hours after it opened, even if the flood goes on. If alerts are still arriving faster than the limit, a new storm opens with its own page.
When it ends, the storm alert resolves with a note saying how it ended and how many of the alerts it held are still open, and one notification goes out, for example Alert storm at Hartley & Webb ended: 14 alerts held for review. It goes to the customer's account manager and technical lead, or, if there is neither, to everyone who works that customer's alerts.
The alerts the storm held are not released in a burst. They stay quiet, listed on the storm's page for review. Work through them from there: resolve what cleared, and raise a ticket for what is still wrong.
Storm settings
Open Settings > Monitoring and find Outages and alert storms under Alert noise.
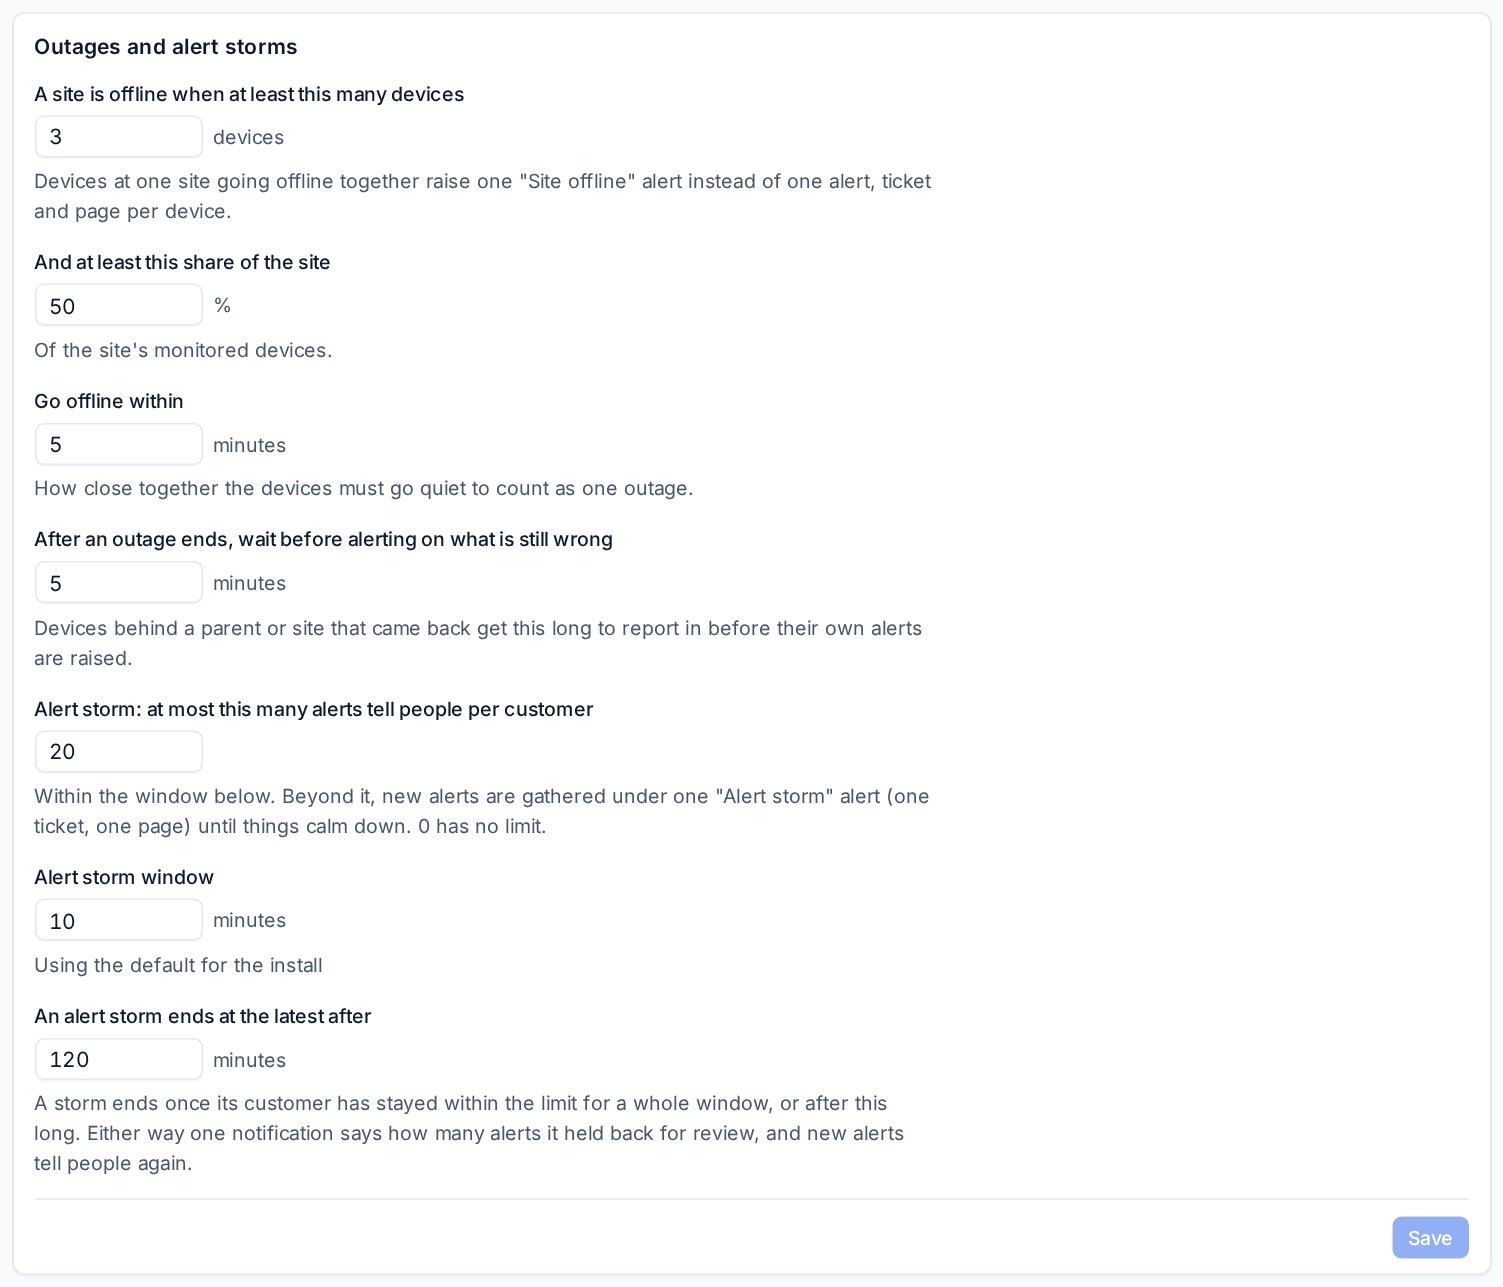
| Setting | Default | What it does |
|---|---|---|
| Alert storm: at most this many alerts tell people per customer | 20 | Beyond it, within the window, new alerts gather under one storm alert. 0 has no limit |
| Alert storm window | 10 minutes | The time the limit is counted over, and how long things must stay calm for the storm to end |
| An alert storm ends at the latest after | 120 minutes | A storm ends after this long whatever happens |
The same card has the Site offline settings, which turn several devices going offline together at one site into one alert. See Alert history, dependencies and flapping.
Tip: An automation rule can react to a storm. The condition Alert storm tells a storm from a single alert, and one of the ready-made rules switches your wall screens to a major incident dashboard until the storm is over. See TV screens, doorbells and phone calls.
One cause, one alert
A storm is about speed. Most floods have one cause, and Tenvara gathers those whatever their speed: when more than 3 alerts about one parent open within 5 minutes, they open under one alert that lists them, at the severity of the worst of them that would have told someone on its own, and only that alert makes a ticket. The parent can be a device, a Microsoft 365 tenant, a backup source, a hypervisor host or a virtual desktop deployment. A vulnerability is gathered per customer from its second device, so one CVE is one alert that lists the devices. Later alerts of the same cause join the parent alert while it is open, and it resolves once none of them is open.
Tenvara also notices when the problem is its own view. If more than half of the sites with always-on devices drop at the same moment, or nothing at all is heard from any device for a few minutes while devices at several sites were heard from in the hour before, it is far more likely that Tenvara cannot see than that every site went down. The availability alerts are then held under one item that says monitoring cannot see its devices, and are raised only if they are still down once it can see again.
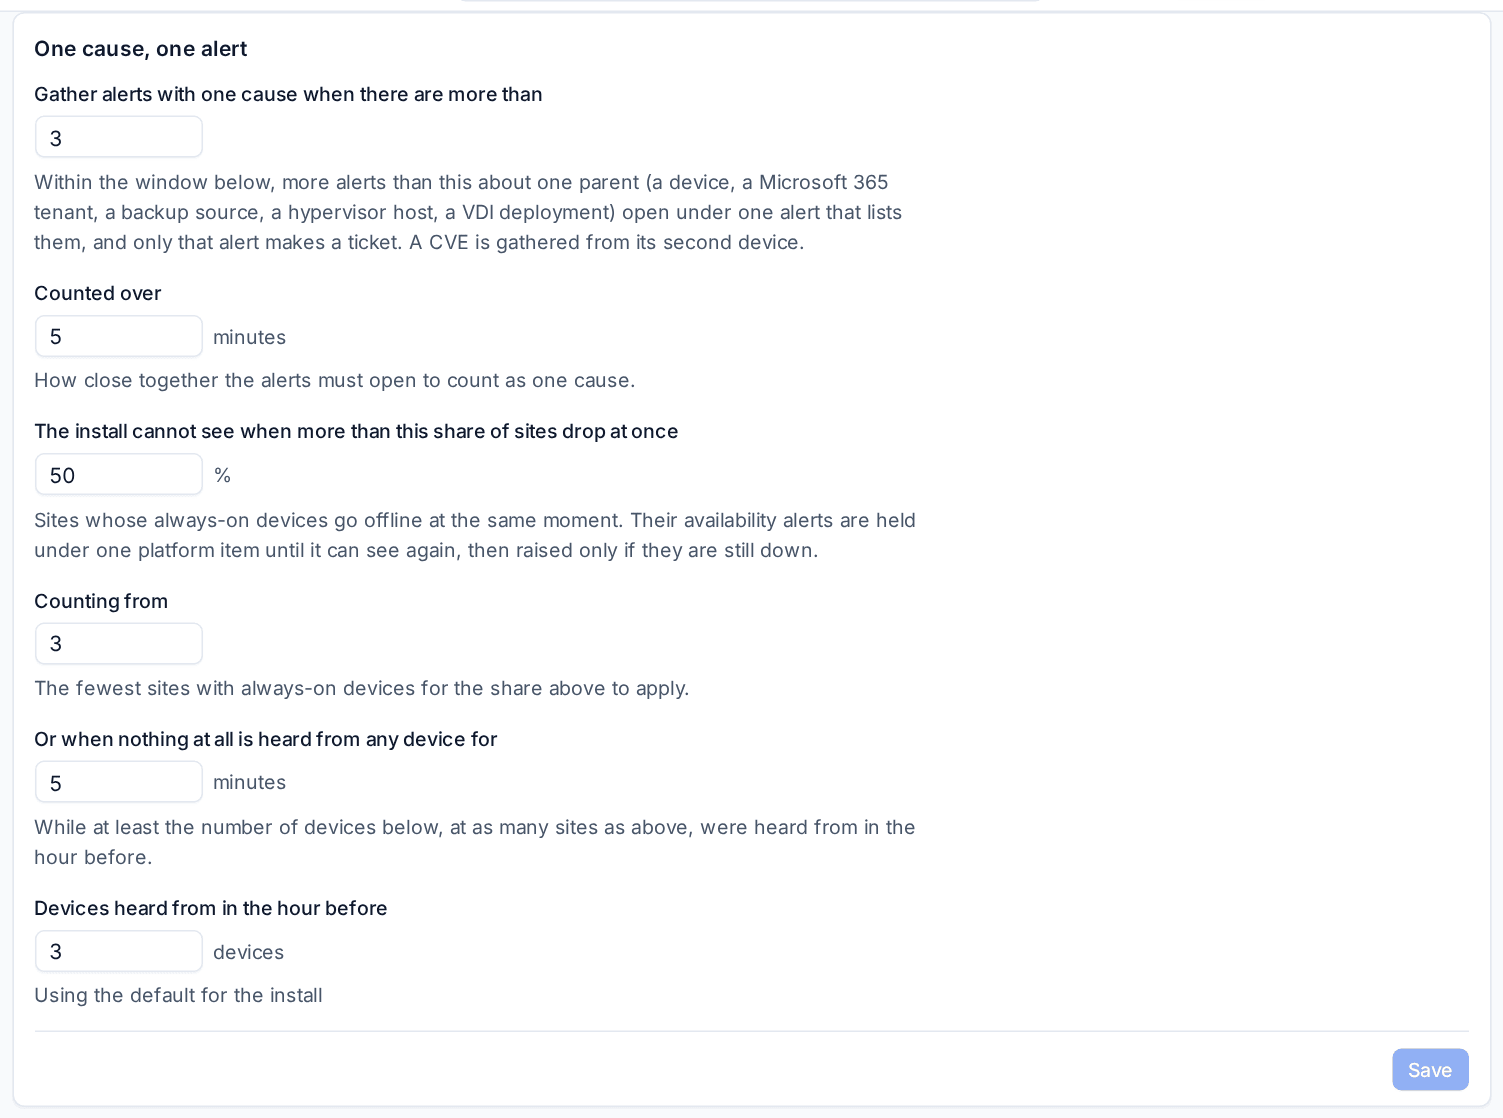
The numbers are on the One cause, one alert card under Alert noise in Settings > Monitoring: Gather alerts with one cause when there are more than, Counted over, The install cannot see when more than this share of sites drop at once, Counting from, Or when nothing at all is heard from any device for and Devices heard from in the hour before.
First-run findings
The first time Tenvara looks at something, it finds everything that was already wrong. That is useful to know, but it is not an emergency, so it goes into a findings report instead of the alert list.
What opens a findings report
| What happens | What is gathered |
|---|---|
| You add a customer, a Microsoft 365 tenant, a domain, devices or a site | What its first scan finds. See Quiet monitoring and onboarding findings |
| A new customer is in onboarding mode | Everything raised for the customer until it is marked live. See Onboarding mode and going live |
| A new check arrives with an update | That check's findings at each customer, on its first run |
| You switch a module on, for everyone or for one customer | That module's findings on its first run |
| A large import | What the imported devices or customer's checks find |
| A backup vendor's first sync | That vendor's alerts |
| A Microsoft 365 tenant is synced again from scratch | That tenant's alerts |
Each customer gets one report. Things that happen together, such as several new checks in one update, share a report, and a first run that starts while a customer's onboarding report is still open joins that report.
Nothing a findings report gathers raises an alert, a ticket, a page or a storm. When the first run is in, or its deadline passes (24 hours by default), the report is ready and the right people get one notification. A report that found nothing tells nobody.
What alerts after the first run
After the report is ready, alerts start as normal for anything that is new or gets worse. A finding that is still open and no worse stays quiet in the report, so you are not told twice about something you already know.
Outside onboarding mode, a first run gathers only what a scan finds. Things that happen, such as a device going offline or a security detection, still alert straight away, so switching a module on never hides something urgent.
To work a report (fix, accept, the counts by area), see Quiet monitoring and onboarding findings.
Findings settings
In Settings > Monitoring, under Alert noise, the Onboarding findings card has:
- Gather a first scan into an onboarding findings report: for new customers, tenants, domains, devices and sites.
- Gather the first run of a change into a findings report: for a new check, a module switched on or a large import. It can be set per customer.
- The first run of a change ends at the latest after: 24 hours by default, for a run that never says it has finished.
Related
Was this page helpful?
Thanks for the feedback.